2. The research output of the survey BACK
The characteristics of the participating universities
There was a large variety of faculties whose management responded to the survey, ensuring a good representativeness to different fields of education. The type of faculties that were more prone to participate in the survey and answered to a larger extent to the questionnaire were similar in the state and in the private universities. Per total the largest proportion (17.8%) came from Economics Faculties, followed by Technical Faculties (16.6%), Teological Faculties (8.9%), Sport faculties (7.8%) and Law Faculties (6.7%). The remaining respondents (42.2%) came from diverse faculties such as psihology, medicine, philosophy, political sciences, math, physics, chemistry, geography, buildings and others. Respondents coming from Economics Faculties hold the largest percentage for both state universities (13.3%) and private universities (4.4%). One difference is given by the fact that there were respondents from Technical Universities from the state higher education institutions, while under the private category there were no such respondents, as these specializations are scarce among private universities.
Towns of headquarters. The largest percentage of the respondents as a share from the total, came from Cluj (18.5%), followed by those from Bucharest (15.4%) and those from Iasi (14.4%). See table no. 4.6.
Table no. 4.6. The towns of the universities’ headquarters
|
Rank |
Town (State) |
No. |
% |
Rank |
Town (Private) |
No. |
% |
Rank |
Town (Total) |
No. |
% |
|
1 |
Cluj - Napoca |
18 |
25.4% |
1 |
Bucuresti |
7 |
26.9% |
1 |
Cluj - Napoca |
18 |
18.5% |
|
2 |
Sibiu |
10 |
14.1% |
2 |
Timisoara |
7 |
26.9% |
2 |
Bucureşti |
15 |
15.4% |
|
3 |
Iasi |
9 |
12.7% |
3 |
Iasi |
5 |
19.2% |
3 |
Iasi |
14 |
14.4% |
|
4 |
Bucuresti |
8 |
11.3% |
4 |
Arad |
4 |
15.4% |
4 |
Sibiu |
10 |
10.3% |
|
5 |
Constanta |
6 |
8.5% |
5 |
Pitesti |
1 |
3.8% |
5 |
Timisoara |
8 |
8.2% |
|
6 |
Craiova |
5 |
7.0% |
6 |
Lugoj |
1 |
3.8% |
6 |
Constanta |
6 |
6.2% |
|
7 |
Pitesti |
4 |
5.6% |
7 |
Brasov |
1 |
3.8% |
7 |
Pitesti |
5 |
5.2% |
|
8 |
Galati |
3 |
4.2% |
8 |
|
|
|
8 |
Craiova |
5 |
5.2% |
|
9 |
Oradea |
2 |
2.8% |
9 |
|
|
|
9 |
Arad |
4 |
4.1% |
|
10 |
Brasov |
2 |
2.8% |
10 |
|
|
|
10 |
Galati |
3 |
3.1% |
|
11 |
Timisoara |
1 |
1.4% |
11 |
|
|
|
11 |
Brasov |
3 |
3.1% |
|
12 |
Targoviste |
1 |
1.4% |
12 |
|
|
|
12 |
Oradea |
2 |
2.1% |
|
13 |
Alba - Iulia |
1 |
1.4% |
13 |
|
|
|
13 |
Targoviste |
1 |
1.0% |
|
14 |
Ploiesti |
1 |
1.4% |
14 |
|
|
|
14 |
Ploiesti |
1 |
1.0% |
|
|
|
|
|
|
|
|
|
15 |
Lugoj |
1 |
1.0% |
|
|
|
|
|
|
|
|
|
16 |
Alba - Iulia |
1 |
1.0% |
|
TOTAL |
71 |
|
TOTAL |
26 |
|
TOTAL |
97 |
|
|||
On overall it was a good representativeness from the point of view of geographical distribution of the universities of teh respondents. See also appendix no. 4.1. that presents a map of Romania.
A new phenomena after 1990, was the setting up of new branches of universities in other towns than the main town (where the headquarter is). The strategy was adopted by traditional state universities, by the new state universities (sett up after 1990) and by the private universities. From the surveyed universities 13.4% operates in only one town, while 27.8% have 2-3 different branches in other towns and the rest have branches in more towns. See table no. 4.7.
Table no. 4.7. Number of branches in different towns of universities
|
No. of towns |
No. of respondents |
% |
|
1 |
13 |
13,40% |
|
2 |
10 |
10,31% |
|
3 |
17 |
17,53% |
|
4 |
7 |
7,22% |
|
5 |
2 |
2,06% |
|
Over 5 |
10 |
10,31% |
|
N.r. |
38 |
39,18% |
|
TOTAL |
97 |
100% |
The size of universities in terms of number of faculties differs from state to private proprietary forms, with the state universities larger in size than private universities.
The number of state universities with one to four accredited faculties was very low (only one state university has 3 accredited faculties), while most of the private universities (42.3% ) have between one and four faculties. While the majority (50.5%) of the responding state universities had more than 10 faculties, there were only 3 private universities (11.5%) with 10 faculties, others having a lower number of faculties. See appendix no. 4.2. The difference in size is reflected also by the average number of faculties that is much lower (7) in case of private universities than in the case of state universites (14). The difference in size can be explained also by the different number of years of functioning of the two types of universities. The newness of the private sector in the Romanian higher education is a reason that explains its reduced size, as compared to the traditional state higher education that has developed over tens of years.
The proportion of accredited faculties in the total number of faculties within an university is generally higher in state universities than in private universities. While the lowest proportion of accredited faculties from the total in a state university is 72.7%, within a private university this is 45.3%. Also while in state universities many have 100% of their faculties accredited, this is not the case in any private university. On average in private universities, 4 out of 7 faculties are accredited. The newness of the private universities explains again the lower proportion of accredited faculties, as it takes time to become equipped from material point of view, as well as to develop the human resources at the level required (see section on accreditation requirements in section I).
Activities of academics
Given the long term experience with the low level of remuneration in state universities, academics traditionally involved themselves in other activities, either in other universities or in extra-academic activities. In the case of our respondents, it was noticed that a low percentage of academics from state universities (4.1%) are involved beside the basic activity at their university in academic activities in private universities, while 35% of them, maily professors (20.6%) are teaching besides the basic norm at their state universities in other state universities. This reflects a shift from the situation at the beginning of 1990’s when many accademics from state universities were teaching in a private university as this was a good source for extra-income for many academics from state universities, while private universities were short of qualified staff. The explanation of the change resides, on the one hand in the fact that private universities had to get their own fully employed academics in order to be accredited (and gave up the services of those academics from state universities who would not come as fully employed to private universities) and on the other hand, in the fact that lately, since state universities have the possibility to organize tuition fee paying programs, there are extra sources of income for state employed academics as well in state universities. On the other hand the percentage of private universities professors who have complementary activities in state universities is explained by the fact that those professors transfered themselves from state universities to private universities, but kept their norms in the state universities as well. The fact is spread among high academic ranks mainly professors, as in order to get accreditation private universities needed at least 30% fully employed professors and senior lecturers, and people with such qualifications could be found only in state universities. In mid 90’s private universities had an intense campaign of racolating professors from state universities both for their experience and for fulfilling the accreditation criteria. There were a number of professors from state universities who took this opportunity, mainly for a better wage that would increase their retirement compensation (calculated at the time as an average of the wage in the last 5 years of work) and also for better positions, such as managerial functions that otherwise they would not have occuppied in state universities.
The reform in higher education
Both in state (87.3%) and private (84.6%) universities managers declared that there were organizatoric changes in their institutions after 1990 and only small percentages (around 6.5%) considered that there were no changes in their instituions.
The main changes that took place in both state and private universities, according to our respondetnts are presented in table no. 4. 8.
The higher education reform influenced both state and private universities as it can be noticed from the respondents’ answers. Fifty percent of the respondents from state universities considered that the most important change that took place in the last 12 years was the increase in the universitary autonomy, while 45.5% of the respondents appreciated that the modernization of the curricula is one of the most important changes, followed by the introduction of the transferable credits system (29.4%). Respondents from the private universities seen as the most important change, the accreditation of their university (60.8%), while 38.4% of the respondents appreciated that the changes in the curricula are among the most important changes and 30.4% appreciated that the introduction of new specializations and programs is of major importance.
Table no. 4. 8. The 3 main changes in universities after 1990
|
No. |
Action |
State |
No. |
Action |
Private |
||||
|
No. |
% from total answers |
% from total respondents |
No. |
% from total answers |
% from total respondents |
||||
|
|
Answered
to this question |
68 |
|
100% |
|
Answered
to this question |
23 |
|
100% |
|
1. |
Consolidation of universitary autonomy |
34 |
18% |
50% |
1. |
Accreditation
of faculties |
14 |
26% |
60.8% |
|
2. |
Modernization of curricula |
31 |
16% |
45.5% |
2. |
Curricula changes |
10 |
19% |
38.4% |
|
3. |
Introduction of transferable
credits |
20 |
10% |
29.4% |
3. |
Setting up new specializations/programs |
7 |
13% |
30.4% |
|
4. |
Changes related to financing |
13 |
7% |
19.1% |
4. |
A new personnel policy |
4 |
8% |
17.3% |
|
5. |
Wages differentiation |
13 |
7% |
19.1% |
5. |
Setting up new faculties |
3 |
6% |
13% |
|
6. |
New specializations/ programs |
13 |
7% |
19.1% |
6. |
Investments in material base |
3 |
6% |
13% |
|
7. |
Introduction of postgraduates programs (Masters and doctorates) |
12 |
6% |
17.6% |
7. |
Financial changes |
3 |
6% |
13% |
|
8. |
Internal reorganization |
9 |
5% |
13.2% |
8. |
The introduction of transferable credits |
2 |
4% |
8.6% |
|
9. |
Development of research activities |
8 |
4% |
11.7% |
9. |
Involving students in academic management |
2 |
4% |
8.6% |
|
10. |
Development of international relations |
8 |
4% |
11.7% |
|
Others |
5 |
|
|
|
|
Others |
17 |
|
|
|
|
|
|
|
|
|
TOTAL
variants to the question |
193 |
|
|
|
TOTAL
variants to the question |
53 |
|
|
We can see both similarities and differences between the main changes that took place in the two types of intitutions. As a difference stands the fact that most respondents from each type of institutions put on the first place (as major change) that aspect of crucial importance and necessity for that particular type of higher education system, that started to be accomplished in the recent years: the state higher education system got more autonomy from MER at institutional level and this was felt by academic management, while the private education system had as main change the accreditation of their universities (starting 2002). On the similarities side is the fact that in both types of educational systems the changes in curricula, was the second frequently mentioned change and this is a positive factor reflecting an increased degree of adaptation at the level of both educational systems.
Most of the private universities in the sample were set up mainly in the period 1990-1994, according to the statements of the respondents coming from those universities (76.9%), while in the case of the state universities there were 8 respondents coming from the 44 universities existent in 1989 in Romania and the rest were from the ones set up after 1990 (30.9% in 1990).
Taking into discussion the characteristics of the reform in the Romanian higher education, only 6 respondents (6.2%) considered that there was no reform in this sector after 1990, 3 of them coming from state universities and the other 3 from private universities. On overall the main characteristics of the reform (as number of times it was mentioned) were considered to be: first the fact that the reform was actually implemented within universities (54.6%) and the fact that it was a gradual reform (54.6%) followed by the fact that it was an eficace reform (35.1%) and that it took place in both sectors state and private (34%). Table no. 4.9. presents the results.
Table no. 4.9. The characteristics of the reform
|
No. |
Characteristic |
State + private |
State |
Private |
||||||
|
No. |
% |
Rank |
No. |
% |
Rank |
No. |
% |
Rank |
||
|
1. |
No reform in HE |
6 |
6,2% |
|
3 |
4,2% |
|
3 |
11,5% |
|
|
2. |
Surface reform |
23 |
23,7% |
|
15 |
21,1% |
|
8 |
30,8% |
4 |
|
3. |
Profound reform |
33 |
34,0% |
4 |
26 |
36,6% |
4 |
7 |
26,9% |
5 |
|
4. |
Gradual reform |
53 |
54,6% |
1 |
42 |
59,2% |
1 |
11 |
42,3% |
3 |
|
5. |
Sudden/rapid reform |
12 |
12,4% |
|
9 |
12,7% |
|
3 |
11,5% |
|
|
6. |
Eficace reform |
34 |
35,1% |
2 |
28 |
39,4% |
3 |
6 |
23,1% |
|
|
7. |
Ineficace reform |
19 |
19,6% |
|
12 |
16,9% |
|
7 |
26,9% |
5 |
|
8. |
Structured reform |
25 |
25,8% |
|
18 |
25,4% |
5 |
7 |
26,9% |
5 |
|
9. |
Disorganized reform |
32 |
33,0% |
5 |
26 |
36,6% |
4 |
6 |
23,1% |
|
|
10. |
Reform only at MER |
9 |
9,3% |
|
5 |
7,0% |
|
4 |
15,4% |
|
|
11. |
Reform implemented in universities |
53 |
54,6% |
1 |
41 |
57,7% |
2 |
12 |
46,2% |
2 |
|
12. |
Reform only in the state sector |
18 |
18,6% |
|
15 |
21,1% |
|
3 |
11,5% |
|
|
13. |
Reform in both state and private sector |
33 |
34,0% |
3 |
20 |
28,2% |
|
13 |
50,0% |
1 |
|
|
Others |
15 |
15,5% |
|
8 |
11,3% |
|
7 |
26,9% |
5 |
|
|
TOTAL |
97 |
|
|
71 |
|
|
26 |
|
|
However, the way academics from state universites appreciated the characteristics of the reform differed from the way the academics from private universities appreciated the characteristics of the reform. While for state university respondents the main 3 characteritics of the reform, were the gradual character of the reform (59.2%), the fact that it was implemented at the level of university (57.7%) and the fact that it was an eficace reform (39.4%), the private university respondents appreciated that the main 3 characteristics of the reform are the fact that the reform envisaged both the state and the private sector (50%), followed by the fact that the reform was implemented at the level of universites (46.2%) and its gradual character (42.3%). The difference is explained by the fact that state universities are interested more in the speed of the reform and facilities granted to them, while private universities have as primary interest the evolution of rules and regulations concerning their existence and their inclusion into the reform directions.
There were also opposite opinions regarding efficacy and the depthness of the reform. Even though 34% of the overall repondents considered that the reform had a profound character, there were another 23.7% who considered that the reform had a superficial character and similarly eventhough there were 35.1% of the respondents who considered that the reform was eficace, there were another 19.6% who considered that the reform was inefficace, with no major differences between respondents from the state and the private universities. See table no. 4.9. above. A large number of respondents (33%) characterized the reform as being disorganized, most of them coming from state universities (36.6% of the state respondents). At the same time there were others who appreciated it as being a structured reform (25.8%).
To conclude, we can appreciate that the main characteristics of the reform in the Romanian higher education, as apprecaited by the management of universities are: its implementation at the university level, its comprehensive scope taking place at the level of both state and privte universites and its gradual character.
Asked what were the main effects of the reform over their universities respondents had again different answers in state and in private universities. See table no. 4.10.
The main 3 effects of the reform as perceived by managerial academics from state universities were: the increased quality of the educational act (27.2%), increased universitary autonomy (27.2%) and changes in the curricula (21.2%). It was also a small percentage of respondents from state universities who had negative appreciations to the reform undertaken in higher education: determined financial difficulties, decreased the quality of the educational act, dezorganization. In private higher education, besides the finalizing of the accreditation process that was perceived positively by 22.7% of the respondents, most of the other perceptions were negative: increased bureaucracy (18.1%), dezorganization (4.5%) or no impact at all (13.6%).
As far as the main tendencies that were noticed in the last 5 years at the level of university in the academic activity, are concerned, the main aspects mentioned on overall by respondents were: the introduction of new academic programs (83.5%), the introduction of new literature in the library (81.4%) and the diversifing of the students’ evaluation methods (79.4%), followed by the increase in the number of students (70.1%) and by the increase in the number of disciplines (39.2%). See table no. 4. 11.
Table no. 4. 10. The main effect of the reform over the university
|
No. |
Main effect |
State |
No. |
Main effect |
Private |
||||
|
No. |
% from total answers |
% from total respondents |
No. |
% from total answers |
% from total respondents |
||||
|
|
Answered to this question/ rate of response |
66 |
92.9% |
100% |
|
Answered to this question/ rate of response |
22 |
84.6% |
100% |
|
1. |
Increase in the quality of education |
18 |
16% |
27.2% |
1. |
Accreditation and new institutions |
5 |
23% |
22.7% |
|
2. |
Larger universitary autonomy |
18 |
16% |
27.2% |
2. |
Increased bureaucracy |
4 |
18% |
18.1% |
|
3. |
Curricula changes |
14 |
12.3% |
21.2% |
3. |
No impact |
3 |
14% |
13.6% |
|
4. |
Improvement in the financial situation and material base |
13 |
11.5% |
19.6% |
4. |
Decentralization |
1 |
5% |
4.5% |
|
5. |
Getting closer to international standards |
10 |
9% |
15.1% |
5. |
Dezorganization |
1 |
5% |
4.5% |
|
6. |
New specialization/ faculties |
10 |
9% |
15.1% |
6. |
The operating environment was reglemented |
1 |
5% |
4.5% |
|
7. |
Difficulties in the financial situation |
5 |
4% |
7.5% |
7. |
Getting closer to international standards |
1 |
5% |
4.5% |
|
8. |
Increase in the number of students |
5 |
4% |
7.5% |
8. |
Changes at organizatoric level |
1 |
5% |
4.5% |
|
9. |
No serious impact |
3 |
3% |
4.5% |
9. |
Unloyal competition from state higher education |
1 |
5% |
4.5% |
|
10. |
Dezorganization |
2 |
2% |
3% |
10. |
Others |
2 |
|
4.5% |
|
11 |
Decrease in the quality of the educational act |
2 |
2% |
3% |
|
|
|
|
|
|
12. |
Others |
7 |
|
10.6% |
|
|
|
|
|
|
|
TOTAL variants to the question |
113 |
|
|
|
TOTAL variants to the question |
22 |
|
|
Table no. 4.11. The main tendencies manifested in the last 5 years within universities
|
No. |
Tendency |
State + private |
State |
Private |
|||||||
|
No. |
% |
Rank |
No. |
% |
Rank |
No. |
% |
Rank |
|||
|
1. |
Increase in the number of students |
68 |
70,1% |
4 |
59 |
83,1% |
2 |
9 |
34,6% |
5 |
|
|
2. |
Increase in the number of disciplines |
38 |
39,2% |
5 |
28 |
39,4% |
|
10 |
38,5% |
4 |
|
|
3. |
Diversifying the methods of students evaluation |
77 |
79,4% |
3 |
57 |
80,3% |
3 |
20 |
76,9% |
3 |
|
|
4. |
Introducing new academic programs |
81 |
83,5% |
1 |
60 |
84,5% |
1 |
21 |
80,8% |
2 |
|
|
5. |
Increasing the number of exams |
23 |
23,7% |
|
17 |
23,9% |
|
6 |
23,1% |
|
|
|
6. |
New literature in the library |
79 |
81,4% |
2 |
55 |
77,5% |
4 |
24 |
92,3% |
1 |
|
|
7. |
Decreasing the number of students |
13 |
13,4% |
|
3 |
4,2% |
|
10 |
38,5% |
4 |
|
|
8. |
Decreasing the number of disciplines |
27 |
27,8% |
|
20 |
28,2% |
|
7 |
26,9% |
|
|
|
9. |
Maintaing/diminishing the teaching methods |
8 |
8,2% |
|
6 |
8,5% |
|
2 |
7,7% |
|
|
|
10. |
Maintaing/diminishing the number of academic programs |
7 |
7,2% |
|
6 |
8,5% |
|
1 |
3,8% |
|
|
|
11. |
Decreasing the number of exams |
27 |
27,8% |
|
22 |
31,0% |
|
5 |
19,2% |
|
|
|
12. |
Decreasing the number of books and titles in the library |
12 |
12,4% |
|
11 |
15,5% |
|
1 |
3,8% |
|
|
|
|
Others |
10 |
10,3% |
|
5 |
7,0% |
|
5 |
19,2% |
|
|
|
|
TOTAL |
97 |
|
|
71 |
|
|
26 |
|
|
|
Again there were differences in the tendencies registered in the state universities and the ones in the private universities. While for the respondents from the state universities the introduction of new academic programs was the main change that occured in the activity of the university (84.5%), followed by the increase in the number of students (83.1%) and the diversification of the methods for student evaluation, the respondents from private universities considered that the main change that took place in the last 5 years was the introduction of new literature in the library (92.3%), followed by the introduction of new programs (80.8%) and the diversification of the evaluation methods (76.9%). The differences have their causes in the different background of the state universities as compared to the private universities and in their different needs. The strict control over the introduction of new academic programs previous to the launch of the reform (through the Education Law of 1995) in the state universities made them to focus on this activity in the last 5 years, when it was permitted by law. For the private universities the start up of their activities at the beginning of 1990 in precarious material conditions and the fact that they started to publish textbooks in mid 90’s and include them in their libraries (as opposed to the beginning of 90’s when they would send their students to state universities’ libraries) transformed this aspect as the main tendency in the last 5 years. However, in both state and private universities the main 3 aspects were mentioned by a large number of respondents (around 80% and over) bringing them close together as characteristics of those periods (the last 5 years).
Asked about the relationship of the universities with the MER in the last two years, most of the respondents from state universities appreciated that is either the same (42.3%) or better (40.8%) as far as the academic autonomy is concerned, and the same (36.6%) or better (42.3%) as far as the financial autonomy is concerned. The explanation is that according to the new legislation more academic and financial decisions can be taken at university level and the fact that respondents perceive it as such, it means that to a certain extent the measure is implemented at university level. In the case of private universities the opinions of respondents were contradictory: there were some (34.6%) who considered that the relationship with MER remained the same as before as far as the academic autonomy is concerned, while another 34.6% considered that there is less academic autonomy in the relationship with the MER, while only 19.2% considered that there is more autonomy. Similarly, 26.9% of the private respondents appreciated that there are the same relations with the MER as far as the financial autonomy is concerned, while other 26.9% appreciated that there is less financial autonomy in the relationship with the MER. Some 23.1% private university respondents appreciated that there is more financial autonomy. The explanation is that according to the latest legislation in the field of higher education (after 1993) private higher education has to comply with certain academic standards, considered by MER as being the ones that can ensure a high quality educational service. Such standards become restrictive for private higher education that did not have to comply to anything previously (before 1993). Also from financial point of view, even though private universities can spend their budgetary funds as their own wish (thing that state universities can not do enterily), the enrolment figure is regulated by the Ministry through direct approval and through the financial leverage (funds are retained by the MER for those students enroled over the approved enrolment figure).
An appreciable improvement was noticed as far as the communication is concerned, as 57.7% of the respondents from private universities mentioned that the communication with MER was better in the last two years. In the case of state university respondents, even though most of the them considered that communication was the same (33.8%) or better (35.2%), there were some (14.1%) who considered that there is less communication with the MER in the last period, bringing the communication as the activity that worsened the most for state universities in the relationship with the MER in the last two years.
We can notice that while for some (the state universities) the reform meant more autonomy in terms of academic and financial autonomy, for others (the private universities) the reform meant more restrictions in terms of academic and financial activities. In this way the reform reached its main purposes: more academic and financial autonomy for state universities (decentralization of more decisions at university level) and a larger degree of control over private higher education (that functioned at its very beginning without any type of regulation and consequently needed to come to set educational standards with which state universities complied already).
Academic and financial autonomy
When asked about the proportion in which the university has autonomy from MER, respondents from state universities had different opinions regarding the academic autonomy: 16.9% of the state university respondents, appreciated that the academic autonomy is very low (0-10%), while other 16.9% of the respondents appreciated that the academic autonomy if medium (41-50%) but almost half of them (46.6%) appreciated that they have high and very high autonomy (70-100%). This include aspects such as: the fact that the curricula is designed at faculty and university level, there is liberty concerning the development of the general academic strategy and the implementation of the system of the transferable credits. However, MER’s actions are seen to be limitative at a smaller or larger extent even by those state university respondents who appreciated that there is high and very high autonomy (70-100%):
„The educational plans are done by us, but they are strictly limited quantitatively and from the content point of view by MER”
or
„The educational plans have more autonomy, the personnel grid is also approved locally, but still the accreditation system limits the liberties”
or
„The educational plans and the enrolment figures are still approved by MER”.
Financial autonomy of state universities from MER is perceived to be lower than the academic autonomy: 28.1% of the respondents appreciated that there is a very low (0-20%) finacial autonomy, while 49.3% appreciated that it is low to medium (20-50%) and only 22,4% considered that state universities have a medium to high and very high financial autonomy from MER (50-100%).
Aspects considered by state university respondents to define the financial autonomy are contradictory. Regarding the budgetary financing, some respondents considered that the funds allocated from MER are administered at the level of faculties with the approval of rectorates (5.2%), but other respondents (15.7%) consider that the way the budgetary funds are allocated denotes a lack of financial autonomy:
„The basic financing (from the state budget) is done by the MER based on incorrect criteria”
or
„We cannot talk about financial autonomy when the quote/student allocated from the state budget is far away from the real necessities”
or
„The conditions from MER regarding the universities’ financiang are too numerous, including the so called „qualitative criteria”.
A larger degree of autonomy is perceived regarding the use of the extrabudgetary funds by some respondents (10.5%), as it is reflected in the following testimonies:
„We have financial autonomy only as far as the extra-budgetary funds are concerned”
or
„We have at our disposal the extrabudgetary incomes to use them according to our own objectives”.
Other respondents (7.8%) perceive that there is financial limitation even in the case of extrabudgetary funds:
„The financial autonomy is reduced because the extra budgetary funds are minimum and part of them have to go to MER”
or
„There is little financial autonomy, as neither the budgetary and the extra budgetary funds can be used with complete autonomy”.
Some other respondents (5.2%) perceive negatively the fact that there is no financial decentralization at the level of faculties in their universities and that the extra-budgetary funds cannot be used at the level of faculty, where they are produced:
„…there is a totalitarism of the Rector who retains 45% of the tuition fee/student”.
In the case of respondents from private universities the answers were contradictory: there were 38.1% respondents who appreciated the academic autonomy from MER to be very low and low (0-30%), while other 50% appreciated that the academic autonomy is high and very high (70-100%). The fact that the academic autonomy in private universities started to be diminished from 100% (as it was at the beginning of 1990’s) is reflected in the respondents’ statements:
„The curriculum autonomy is standardized by the Council for accreditation (CNEAA) and the dydactic and functional autonomy is standardized by MER”
or
„MER and the CNEAA have the tendency to impose standard educational plans and management structures as in the state institutions”
or
„By imposing the number of hour/discipline and the number of years/program, the autonomy goes towards zero”.
In terms of financial autonomy 30.8% of the respondents from private universities consider that the financial autonomy is very low (0-10%), while the majority of the respondents (69.2%) consider that the financial autonomy is medium to high and very high (50-100%) with 26.9% appreciating a very high financial autonomy from MER (90-100%). This shows that eventhough financial autonomy started to be restricted in private higher education, it is still high and anyhow higher than in state higher education. The diminishing financial autonomy in private universities is reflected by the fact that many respondents (33.3%) consider that the taxes that private institutions have to pay to MER (at least 10% according to law[1]) is not justifiable and also by the fact that „private HE does not receives any financial support from state as stipulated by the law, but the contrary” (11.1%).
The autonomy of faculties from universities is similar in the state and the private higher education, in respect to academic activities: 90.1% for state universities respondents and 84.6% of the private university respondents stated that faculties have academic autonomy from their universities. The situation is different in respect to the financial activities, as 59.2% of the respondents from state universities stated that there is financial autonomy of faculties, while 35.2% stated that there is no financial autonomy from university. This reflects a heteregenous situation in the state higher education, where some universities implemented the decentralization principle up to level of faculty, while other did not.
At the level of private universities only 26.9% respondents declared that there is financial autonomy at faculty level, while 65.4% stated that there is no financial autonomy at university level. Most private universities function based on more centralized financial principles as they are usually dependent on a very small group of persons (in many cases just one person: the owner or the founder) and they are much smaller in size than state universities, they have a smaller number of faculties that can be managed together in an unitary way.
Asked openly what are the 3 main decisions from universities that need approval from the MER, respondents from state and private universities had answers similar to a certain extent, as it can be noticed in table no. 4.12. The only difference consisted in the need of approval for investments in the case of state universities, another sign of stricter financial restrictions for state universities as compared to private universities.
Table no. 4.12. The 3 main decisions that need approval from the MER
|
No. |
Main decisions that need
approval from the MER |
State |
No. |
Main decisions that need
approval from the MER |
Private |
||||
|
No. |
% of answers |
% from total respondents |
No. |
% of answers |
% from total respondents |
||||
|
|
Total respondents/ rate
of response |
40 |
56.3% |
100% |
|
Total respondents/ rate
of response |
21 |
80.7% |
100% |
|
1. |
Enrolment
figure |
28 |
25% |
70% |
1. |
Occupying the academic
positions |
17 |
28% |
80.9% |
|
2. |
Invetsments, the budget |
25 |
23% |
62.5% |
2. |
New programs, specializations |
16 |
27% |
76.1% |
|
3. |
New programs, specializations |
22 |
20% |
55% |
3. |
Enrolment figures |
14 |
23% |
66.6% |
|
4. |
Occupying the academic positions |
14 |
13% |
35% |
4. |
Educational plans |
5 |
8% |
26.9% |
|
5. |
Educational plans |
7 |
6% |
17.5% |
5. |
Others |
8 |
13.3% |
|
|
6. |
Others |
14 |
12.7% |
|
|
|
|
|
|
|
|
TOTAL alternatives |
110 |
|
|
|
TOTAL alternatives |
60 |
|
|
The contribution of different bodies (such as MER, rectorates, decanates, heads of departments and members of departments) over the specific academic and financial activities within universities was analysed and there was identified to whom belongs the initiative, the approval, the planning, the coordination, the implementation, the monitoring and control and also the advicing activities. Appendices no. 4.3. to 4.7. present how, according to our respondents’ opinions each body contributes to the main activities within an university.
MER: the main activities in which the Ministry of Education and Research is taking initiative and influences the activity within an university are the admittance (mainly criteria) (12.4%), the licencing (mainly criteria)(10%) and setting the wages (11%), while in terms of approving, the main MER approval decision that affects universities is related to the enrolment figure (66%). Indeed for both state and private universities the enrolment figure, for both state budgeted and tuition fee paying places, has to be approved by the MER. The financial instrument (reducing the budget by certain percentages for overlapping the approved enrolment figure) is used for keeping the enrolment figure at the level desired by MER. Other activities on which a large number of respondents agree that need MER’s approval: the budget at the level of university (37.1%), promoting academics (criteria and process) (34%) and the licencing criteria (27%).
MER is also seen by small percentages of the respondents (11.3%) that has a planning role in the licencing process, as well as a coordinating role (15%). However, the approving activity remains the main mean through which the Ministry is influencing the activity at the university level. See appendix no. 4.3.
Rectorates: The main roles fulfilled by rectorates, according to our respondents are approving, coordinating and planning. The main activities that need the rectorates’ approval are: recruiting new personnel (66%), setting the curricula (66%), setting the wages (60%), setting the budget of the faculty, introducing new academic programs (53%).
The processes of admittance, licencing and academics promotion are the main activities over which respondents agreed to a large extent that rectorates play an important role in their coordination. Admittance, promotions and setting the enrolment figures are also planned at the level of university by rectorates. Rectorates are seen as taking initiatives mainly in setting the budget at university level (24%), the wages (22%) and participating at the implementation of the university budgets (34%). See appendix no. 4.4.
Rectorates are influencing through their approval, planning and coordination all aspects of academic life from personnel activites (recruitment, promotion, wages), to academic activities (curricula and academic programs) and to budgetary activities (budget at the level of universities and faculties). A lot of decision power stands in the hands of rectorates and in these conditions a lot of the academic life of universities is influenced by the type of decisions, the flexibility, the quality of the decisions taken by their rectorates. They are the major body responsible for the dissemination and implementation of teh reform at the university level, according to the activities they are responsible for.
Decanates. Are seen as having as main roles almost all types of contributions: to take initiative for a number of activities, to approve a number of activites, to plan, to coordinate, to implement, to advice and to a small extent to monitor and control.
Decanates initiate the setting of enrolment figures (56%), the criteria for evaluation (43%), the introduction of new academic programs (38%), the recruitment process (38%) and sett the curricula (37%). Decanates also approve course outlines (42%), the introduction of new disciplines (40%), giving up other disciplines (35%) and the evaluation of students (31%). In terms of planning, the main activities they plan are the licencing process (39%), the admittance process and the evaluation of students (28%). The main coordinated activites are the same as the planned ones and as far as the implementation is concerned decanates play a major role in the admittance and licencing processes, in implementing the curricula and the budget at the level of faculty (where there is one). See appendix no. 4.5.
Decanates are the bodies with the most complex activity within the university, in the sense that they are involved at all levels from initiation to implementation, they are the main operational bodies within an university.
Heads of departments have as main activities initiation, monitoring and advicing. Initiative about introduction of new disciplines (48.5%), about giving up some disciplines (43.3%), introduction of new academic programs (42.3%), evaluation of students (33%), setting the curricula (32%) are the main aspects heads of departments start the dsicussion about. The second role they are perceived to have, the monitoring refers to activities such as admittance (21%), recruitment and enrolment figure (20%) and the budget at faculty level (18%). Advicing as a third main contribution of heads of departments envisages the evaluation of students (22.7%) and setting licencing criteria (20.6%). They also coordinate activites such as setting the course outline (14.4%) and evaluation of students (20.6%) and implement activities such as setting the course outline (16.5%), setting the promotion criteria (15.5%) and introducing new disciplines (13.4%). See appendix no. 4. 6.
Members of departments have as main roles to monitor, advice and take initiative, according to our respondents with the main contribution in monitoring the curricula (38%), evaluation of students (34%) and monitoring the admittance process (28%). They are seen as implementing the admittance process, the sett of curricula and the valuation of students, as well as advicing in the evaluation of students and in the licencing process. See appendix no. 4.7.
Table no. 4.13. presents sythetically the 3 main roles that each body performs in relationship with all activities (according to the respondents from this study):
Table no. 4.13. Main activities run by educational bodies
|
Body |
Rank |
Activity |
|
MER |
1 |
Approval |
|
2 |
Inititiave |
|
|
3 |
Coordination and planning |
|
|
Rectorates |
1 |
Approval |
|
2 |
Coordination |
|
|
3 |
Planning |
|
|
Decanates |
1 |
Initiative |
|
2 |
Approval |
|
|
3 |
Planning |
|
|
Heads of departments |
1 |
Initiative |
|
2 |
Monitoring and control |
|
|
3 |
Advicing |
|
|
Members of departments |
1 |
Monitoring and control |
|
2 |
Initiative |
|
|
3 |
Advice |
Most of the initiatives belong to decanates, as they are the operative bodies in the management of the academic activity. Therefore, setting the enrolment figures, setting the admittance criteria and introducing new academic programs are the main activities for which the initiative belongs to decanates.
Most of the approvals take place at the level of rectorates as they approve the curricula, the recruitment process and the wages, as well as the budget at the level of faculty and the introduction of new academic programs, followed by the MER and the decanates.
The planning activity is the most intense at the level of decanates where admittance, licencing, the budget and the curricula is planned annualy, followed by rectorates and heads of departments.
The coordination activity is again the most intense at the level of decanates, that are involved in coordinating admittance, licencing, promotions, evaluation of students and others, followed by rectorates and heads of departments.
The implementation of activites is performed by decanates first of all, followed by heads of departments and members of the departments, while de monitoring and the control is fulfilled by rectorates, decanates and members of departments.
Department members have a strong role in advicing over the curricula (38.1%), the evaluation of students (35.1%) and the course outline and admittance evaluation criteria (28.9%).
Decanates have a major contribution at all types of roles in most operative activities such as admittance criteria and process, licencing criteria and process, recruitment and promotions of personnel, setting the wages, setting the curricula, setting the enrolment figure, introduction of new programs, introduction and giving up of new disciplines and evaluation of students. Decisions for most academic activities is (according to our respondents) decentralized at the level of decanates.
Rectorates have a larger contribution to dismissal of staff and to setting the budgets, while heads of departments contribute to a larger extent to setting the courses outline. Rectorates have also an important role in disseminating information about the reform further down the line and also to take decisions and measures for the implementation of the new rules and regulations and also of the new opportunities and liberties. We can notice that there are some decisions centralized at the level of universities (staff dismissal and budgets) and other decentralized at the level of heads of departments (course outlines).
The academic activity
Most of the respondents both from state (38%) and private (30.8%) universities, appreciated that the curricula has changed over the last 12 years in a medium proportion (40-60%). Another 46.5% respondents from state universities and 30.7% from private universities appreciated that the changes took place in a large and very large proportion (60-100%). See table no. 4. 14. This is an indication over the extent of changes operated over time over curricula within both state and private universities. Only a small percentage (12.7%) from state universities appreciated that the changes in curricula were small and very small (0-40%). At the same time, a larger percentage of the respondents coming from private universities (30.7%) appreciated that there were small and very small changes operated in the curricula. A reason for this can be that the curricula in private universities were set after 1990 and had a higher degree of flexibility and adaptability to market demands than state universities curricula, therefore corresponding more to such demands from the very beginning. Also this can be a sign that some of the private universities are more conservative in adapting to changes in curricula and less open to new.
Table no. 4. 14. Proportion of changing the curriculum in the period 1990-2002 at faculty level.
|
Percetange |
State |
Private |
||
|
No. |
% |
No. |
% |
|
|
Very large (80-100%) |
12 |
16.9% |
3 |
11.5% |
|
Large (60-80%) |
21 |
29.6% |
5 |
19.2% |
|
Medium (40-60%) |
27 |
38.0% |
8 |
30.8% |
|
Small (20-40%) |
7 |
9.9% |
7 |
26.9% |
|
Very small (0-20%) |
2 |
2.8% |
1 |
3.8% |
|
N.r. |
2 |
2.8% |
2 |
7.7% |
|
TOTAL |
71 |
|
26 |
|
It can be noticed that both types of universities combine all possible sources of suggestions for improving the curricula in a relatively equilibrated way, using both internal and external sources. The most frequently used sources of inspiration for these changes in the curricula, were in both state and private universities curricula from Western countries (around 80% of respondents) and the proposals of academics (56.3% in case of state universities and 73.1% in case of private universities), as presented in table no. 4. 15.
Table no. 4.15. The ways in which curricula was changed in universities
|
|
State |
Private |
||
|
No. |
% |
No. |
% |
|
|
Inspired from the curriculum from Occident |
57 |
80.3% |
21 |
80.8% |
|
At the decanates level according to the academics available to teach a subject (discipline) |
16 |
22.5% |
6 |
23.1% |
|
At the academics proposals |
40 |
56.3% |
19 |
73.1% |
|
At the students’ proposal |
19 |
26.8% |
13 |
50.0% |
|
Through consultation with the business community |
18 |
25.4% |
9 |
34.6% |
|
Other |
38 |
53.5% |
11 |
42.3% |
|
TOTAL |
71 |
- |
26 |
- |
It is interesting to notice that the country with the most influence over the changes in curricula, was for both state and private universities, France, as 60.8% of the respondents mentioned it as a country whose curricula were used as an inspiration source for changes in the Romanian curricula. See table no. 4.16. below. The explanation can reside in a few aspects: the traditional cooperation between Romania and France, the cultural closeness with this country as both are latin countries, the fact that at the begining of 1990’s when such changes started to occur, France was a country closer to Romania contributing with input to its overall change and generaly it was a good country of origin effect in Romania for everything coming from France. Another factor can be the fact that decision makers at the time were people who would know as foreign languages French and Russian, given the way the system of education was organzied when they were in school. After mid 1990’s a shift was noticed and changes in the Romanian higher education, started to use as a source of inspiration the Anglo-Saxon educational systems. This is why at present we have in our state universities Advanced Studies (after the French model Etudes Aprofondee) as well as Master studies (as in the Anglo-Saxon system). Private universities indicated United States as the country being the second source of inspiration for their curricula, being closer to the general orientation at the global level.
Table no. 4.16. The main countries - sources of inspiration for changes in curricula
|
No. |
Countries |
State + private |
State |
Private |
|||
|
No. |
% |
No. |
% |
No. |
% |
||
|
1. |
France |
59 |
60.8% |
42 |
59.2% |
17 |
65.4% |
|
2. |
Great Britain |
31 |
31.9% |
27 |
38.0% |
4 |
15.4% |
|
3. |
Germany |
30 |
30.9% |
23 |
32.4% |
7 |
26.9% |
|
4. |
USA |
29 |
29.8% |
20 |
28.2% |
9 |
34.6% |
|
5. |
Italy |
15 |
15.4% |
9 |
12.7% |
6 |
23.1% |
|
|
TOTAL |
97 |
- |
71 |
- |
26 |
- |
Both state and private universities respondents indicated other countries as sources of inspiration, mainly from Western Europe: Belgium, Spain, Switzerland, Greece, Netherlands, Vatican and others.
In 1995, the reform in the Romanian higher education system was launched in a more organized way, and new educational programs started to be introduced. The period 1995-1997 was characterized by the setting up of a number of Advanced Studies programs, mainly in state universities, while after 1999, when the reform in the Romanian higher education was relaunched and the aligning to the European education standards became an objective of the reform, more Master programs were introduced, as well as other types of postgraduate studies responding to the long-life learning neccessities. In state universities the largest percentage of new programs were postgraduate programs. Private universities introduced Master programs (32.4% of the respondents) only after 2001, when the first private universities have been accredited. See table no. 4. 17.
Table no. 4.17. New educational programs after 1995
|
No. |
Type of program |
State |
Private |
||
|
No. |
% |
No. |
% |
||
|
1. |
Masters |
45 |
26,8% |
12 |
32,4% |
|
2. |
Advanced Studies |
38 |
22,6% |
0 |
0,0% |
|
3. |
Post-graduates studies |
54 |
32,1% |
9 |
24,3% |
|
4. |
Doctorates |
19 |
11,3% |
2 |
5,4% |
|
5. |
Others |
8 |
4,8% |
0 |
0,0% |
|
|
N.a. |
4 |
2,4% |
14 |
37,8% |
|
|
TOTAL |
71 |
- |
26 |
- |
On average in the period 1990-2002, there were introduced 13 new programs in state universities and 3 new programs in private universities. The initiation of such new programs was based in both state and private universities on a centralized decision at the level of MER. In the case of state universities the decision came from the MER (in the form of reccommendation) and was transmitted further down the line to universities and further on, to faculties. However the perception of our respondents was that they were the initiators of such new programs and to a certain extent this is true. In the moment when they were allowed by law to introduce new programs they were asked by the rectorates to develop new programs, that were further approved at the university and at MER level. In the first year when the MER allowed the introduction of Master programs for instance (1999), the programs were introduced in many universities based on indications from rectorates. In the subsequent years the initiative was at the level of faculties and departments. In a similar way in private universites, once they were accredited, they were allowed to introduce new post-graduate programs and the programs have been designed at university/rectorates level, as stated by 43.4% of the respondents and at the level of faculty/decanates as stated by 56.7% respondents. This came as a difference as compared with what repondents from state university declared were the initiative came from the faculty/departments level mainly (84%).
Improving the quality of teaching is one way to improve the quality of education. Organizing teacher training so that to improve the teaching of academics is one way to deal with the issue of quality in education. When asked if there are organized teacher training activities within their universities it was noticed that this preoccupation is higher in state universities (73.2%) than in private universites where only 30.8% of the respondents declared that there are organzied teacher training activities. See table no. 4. 18.
Table no. 4.18. Teacher training in universities
|
Teacher training |
State |
Private |
||
|
No. |
% |
No. |
% |
|
|
Yes |
52 |
73,2% |
8 |
30,8% |
|
No |
10 |
14,1% |
12 |
46,2% |
|
Don’t know |
7 |
9,9% |
2 |
7,7% |
|
N.r. |
2 |
2,8% |
4 |
15,4% |
|
TOTAL |
71 |
|
26 |
|
From the 52 respondents from the state universities that organized teacher training, 61.5% declared that the initiative for this activity belonged to the management of the university, while other 28.8% declared that it came as a request from academics. Similar initiators were in the case of the 8 private universities that organized teacher training. The trainers that participated to the teacher training sessions were mainly domestic trainers, most of them being specialists from the pedagogical faculty or trainers from the own academic staff of the university. Only 15% of the respondents stated that foreign trainers were also involved in teacher training. The contribution of new ways of teaching is very important to the process of improving teaching in universities, and this is helped better by learning from people who come from different educational systems, rather than people coming from the same educational system, who have traditional (and in many instances outdated) ways of teaching. Neither state or private universities benefited from extensive training from external sources.
Both in state and private universities it was stated that the participation was large at the level of assitants and junior assitants (over 80% of academics) (as in many state universities academics at entry level are obliged to participate in such teacher training courses), medium and high (at the level of lecturers), while at the level of higher academics ranks (such as professors and senior-lecturers) it was declared that they did not participate at all or only a very low (10%) proportion participated. The repondents’ answers indicate a good preocupation for helping the new comers to gain skills in the pedagogical field in both types of universities, but on the other hand a reluctance to improve the teaching of higher ranked academics. It is true that on the one hand, the experience can be a good source of good teaching practices for many of these academics, but on the other hand, given the objective of transforming higher education and make it more practical oriented (something that the Romanian education traditionally is not), there is a need for skill oriented teacher training at all levels, including the superior ones, that is not fulfilled in the Romanian universities.
One way to improve the quality of higher education is to respond to a larger extent to the requirements of its beneficiaries, one category being the students. In order to respond to their needs, universites have first of all to find out what are their needs on a systematic basis, and one way to do this is by introducing evaluation of courses and of the professors by the participating students. From our respondents 64.9% declared that there were introduced in their universities systems of getting feed-back from students based on evaluation, in a similar proportion in the state and in the private universities. See table no. 4. 19.
Table no. 4. 19. Existance of evaluation of the courses and professors by students
|
|
State + private |
State |
Private |
|||
|
|
No. |
% |
No. |
% |
No. |
% |
|
Yes |
63 |
64,9% |
46 |
64,8% |
17 |
65,4% |
|
No |
26 |
26,8% |
18 |
25,4% |
8 |
30,8% |
|
Don’t know |
5 |
5,2% |
5 |
7,0% |
0 |
0,0% |
|
N.r |
3 |
3,1% |
2 |
2,8% |
1 |
3,8% |
|
TOTAL |
97 |
|
71 |
|
26 |
|
Most of them introduced the systems after 1998, when the directions of the relaunched reform reccomended such information gathering systems, but the activity became really intense after 2000 (as stated by 71.7% from the respondents of state universities and 53% of the respondents of private universities). In most cases the organizers of the class evaluation systems were the decanates and the rectorates in both state and private universities, as noticed in table no. 4.20., with other ways of organizing this activity, used at a lesser extent.
Table no. 4. 20. Organizers of the class evaluation processes
|
Organizers of class evaluation |
State |
Private |
||
|
No. |
% |
No. |
% |
|
|
Students |
3 |
6,52% |
6 |
35,3% |
|
Decanate |
28 |
60,87% |
10 |
58,8% |
|
Rectorate |
16 |
34,78% |
7 |
41,2% |
|
The option of the course professor |
9 |
19,57% |
4 |
23,5% |
|
Others |
6 |
13,04% |
1 |
5,9% |
|
Nr. |
2 |
4,35% |
0 |
0,0% |
|
TOTAL respondents to this question |
46 |
|
17 |
|
Communication between the members of an university can influence the quality of decision making and the effects of the reform, therefore it was studied the way the respondents to the study appreciated the communication processes within their universities. In state universities 70.4% of the respondents appreciated that 70% and more of the messages reach the academics in time and with a good degree of acccuracy, while in the case of private universities there were 88.5% who appreciated timeliness of messages as being good (over 70% come in time) and 80.7% appreciated a good accuracy of communication (over 70% of the messages come in acurate form).
The main ways of communication between members of the universities were diverse in both types of universities, (as seen in table no. 4. 21.) with a larger proportion of the state universities (49.3%) using the modern ways of commmunication (e-mailing to everybody).
In terms of meetings within departments, that can be used to facilitate more personal communication (in terms of disseminating information and receiving feed back from academics), it was noticed that in state universities there were organized more department meetings within an academic year than in private universities as it can be noticed in table no. 4.22. This can be a sign of a more centralized decision making at the level of private universities, where most of the decisions are taken at management level with less debate with the academics.
Table no. 4. 21. The main communication means used to communicate to academics the decisions taken by the management
|
No. |
Means of
communication within universities |
State |
|
Private |
|
|
No. |
% |
No. |
% |
||
|
1. |
Communication
through representatives (HD) |
64 |
90,1% |
18 |
69,2% |
|
2. |
Display on
the board |
39 |
54,9% |
19 |
73,1% |
|
3. |
Communication
through the department’s secretary |
30 |
42,3% |
10 |
38,5% |
|
4. |
Transmitted
personally through e-mails to everybody |
35 |
49,3% |
6 |
23,1% |
|
5. |
Written
communication to everybody |
15 |
21,1% |
7 |
26,9% |
|
6. |
Others |
7 |
9,9% |
6 |
23,1% |
|
7. |
TOTAL |
71 |
- |
26 |
- |
Ninetyfive percent of the respondents (all managerial staff) mentioned that they have participated in all meetings at the level of department, showing a good communication with their colleagues and subordinates.
Table no. 4.22. Number of department meetings within an year
|
Number |
No. of meetings that have taken place in the department |
|||
|
State |
Private |
|||
|
|
No. |
% |
No. |
% |
|
0 |
1 |
1,4% |
2 |
7,7% |
|
1-2 |
2 |
2,8% |
4 |
15,4% |
|
3-5 |
10 |
14,1% |
7 |
26,9% |
|
6-8 |
13 |
18,3% |
12 |
46,2% |
|
9-12 |
26 |
36,6% |
0 |
0,0% |
|
12-24 |
12 |
16,9% |
1 |
3,8% |
|
> 24 |
7 |
9,9% |
0 |
0,0% |
|
N.r. |
0 |
0,0% |
0 |
0,0% |
|
TOTAL |
71 |
- |
26 |
- |
Aspects related to the budget
Most of the respondents in both state universites (50.7%) and in private universities (76.9%) stated that they do not know what is the total budget of the university, while 16.9% from state universities and 19.2% from private universities did not answer at all to this question. The low rate of response to this question can be explained on the one hand on the fact that this is considered to be confidential information, not to be disclosed. Respondents from private universites mentioned that „they are private university and do not have to give any information about financial aspects”. The issue is sensitive especially for private universities, as some of them might underdeclare the number of enrolled students and their income in order to avoid paying the extra-taxes required by the MER. This might be the case also with state universities, too, given the fact that they have the same regime, as far as the tuition fee paying places are concerned. On the other hand, the fact that most of them stated that they do not know what is the total budget, can be a sign that the activity is very centralized from financial point of view at the level of university. This is definitively the case with those universities that do not have budgets at the level of faculties. From the small percentage of respondents who answered this question, it was noticed that budgets at the level of the state universities (up to 50 bil. lei[2]) are lower than that of the private universities (between 50 and 100 bil. lei). Private universities had only extra-budgetary financial sources. Even if the legislation stipulates that accredited private universities can benefit from the financial state support, it was not the case so far with universities of our respondents. An explanation can be that only in spring 2002 were the first private universities accredited and there was not enough physical time to apply and to obtain funds from MER. State universities respondents declared that the extra-budgetary funds increased in proportion of the total budget in the last years (1999-2002). For the academic year 1999-2000, 19.7% of the state university respondents stated that the extra-budgetary sources represented under 25% from the total budget, 11.3% stated that the percentage of extrabudgetary sources was between 25-50% and only 1.4% stated that extrabudgetary sources represented between 75-100% of the total budget. In the academic year 2001-2002, the percentage of extrabudgetary sources in the budget increased: 21.1% of the state university respondents stated that extrabudgetary funds represented under 25% of the total budget, while 9.9% had a 25-50% and 14.1% had a 15-100% contribution of the extrabudgetary sources to the total budget. The slight increase of the extra-budgetary sources in the total budget of state universities shows that stqte universities started to learn to attract other sources than those received from the state budget.
A large percentage of our respondents coming from state universities (77.5%) stated that within their faculties there are budgets at the level of faculty, while in private universities only 26.9% stated that they have budgets at faculty level, most of them 46.2% stating that they do not have budgets at the level of faculty. This shows that in private universities the degree of financial centralization is higher than in state universities. While in state universities decanates play the major role (70.4%) in gathering extra-budgertary funds, in private universities the major role stands with rectorates as stated by half of the respondents (50%). See table no. 4.23. bellow.
Table no. 4. 23. Contribution of different bodies to gathering extra-budgetary funds
|
Organisms |
State |
Private |
||
|
No. |
% |
No. |
% |
|
|
Rectorates |
25 |
35,2% |
13 |
50,0% |
|
Decanates |
50 |
70,4% |
9 |
34,6% |
|
Head of department |
39 |
54,9% |
4 |
15,4% |
|
Academics with no managerial position |
30 |
42,3% |
6 |
23,1% |
|
Economic Director |
6 |
8,5% |
3 |
11,5% |
|
Administrator university |
5 |
7,0% |
0 |
0,0% |
|
Nr |
8 |
11,3% |
9 |
34,6% |
|
TOTAL |
71 |
|
26 |
|
In the case of state universities most of the respondents (42.3%) declared that faculties have to hand in to universites 30% of the extrabudgetary funds, while 7% of the respondents presented highly centralized situations when all extra-budgetary funds have to be handed in to universities. See table no. 4. 24. Private university respondents had a very low rate of responde to this question and the few who answered presented contradictory situations: 11.5% stated a very centralized situation when all funds are handed in to universities, while other 23% stated that they do not have to hand in anything to universities (11.5%) or that they have to hand in only 10% of the income.
Table no. 4.24. Proportion in which the university takes over from the extra-budgetary funds attracted by faculties
|
Proportions |
State |
Private |
||
|
No. |
% |
No. |
% |
|
|
0% |
0 |
0,0% |
3 |
11,5% |
|
10% |
1 |
1,4% |
3 |
11,5% |
|
20% |
11 |
15,5% |
1 |
3,8% |
|
30% |
30 |
42,3% |
0 |
0,0% |
|
40% |
11 |
15,5% |
0 |
0,0% |
|
50% |
3 |
4,2% |
1 |
3,8% |
|
60% |
1 |
1,4% |
0 |
0,0% |
|
70% |
0 |
0,0% |
0 |
0,0% |
|
80% |
0 |
0,0% |
0 |
0,0% |
|
90% |
1 |
1,4% |
0 |
0,0% |
|
100% |
5 |
7,0% |
3 |
11,5% |
|
N.r. |
8 |
11,3% |
15 |
57,7% |
|
TOTAL |
71 |
|
26 |
|
Asked about the degree of difficulty in obtaining approval from MER for different categories of funds, all private universities respondents stated that it is not the case. Regarding state universities some respondents (14.1%) declared that it is easy to obtain funds for personnel expenses and for current student house expenses (11.3%) while the categories of expenses seen as being the most difficult to obtain approval from MER are: investment in educational premises (62%), investment in student houses (52.1%), library expenses (29.6%) and personnel expenses (25.4%). Some 32.4% respondents from state universities declared that there is no need for approval from MER for the current expenses, reflecting the perception of existent financial autonomy of universities from MER. While financial autonomy is perceived as being a natural thing by private university respondents, in the case of state university respondents, a large percentage still see to be a difficult task to obtain approval for funds from MER.
Asked about the percentage of funds that universities have to hand in to MER, 21.1% of the state university respondents stated that they have to hand in between 10-40% of their extrabudgetary income to MER, while the private university respondents (26.9%) stated that they have to hand in 10% of their income. To be noted is the fact that the non-response rate to this question was very high (57.7% state respondents and 61.5% of the private respondents), being an issue that was preffered to be avoided by the respondents.
Asked about the level of the tuition fees, most of the respondents prefered to give the figures in $ than in Romanian Lei (the local currency), as a reflection of the fact that the costs and the tuition fees are calculated in hard currency in Romania due to the still high level of inflation. Table no. 4.25. presents the level of tuition fees in state and private universities as an average for different types of programs.
Table 4 .25. The level of tuition fees for the academic year 2002-2003
|
Level
|
USD (tuition fees) |
|||||||
|
State |
Private |
|||||||
|
Average |
% |
N.r. |
% |
Average |
% |
N.r. |
% |
|
|
Licence |
368 |
59,2% |
11 |
15,5% |
334 |
30,8% |
5 |
30,8% |
|
Advanced studies |
318 |
42,3% |
18 |
25,4% |
n.a. |
0,0% |
12 |
30,8% |
|
Master |
342 |
67,6% |
4 |
5,6% |
150 |
3,8% |
11 |
30,8% |
|
Doctorate |
265 |
18,3% |
14 |
19,7% |
300 |
3,8% |
0 |
30,8% |
|
TOTAL |
|
|
71 |
|
|
|
26 |
|
*) The difference up to 100% between respondents and non-respondents is represented by those who stated that they do not know to answer to this question and those who mentioned that it is not the case in their universities.
We can notice that on average the level of tuition fees for most tuition fee paying programs in state universities is higher than the level of tuition fees for similar programs in private universities. State universities charge higher than private universities, as they count on their good name on the market and on the fact that they offer a fully and straight foward recognized diploma, as compared to private universities, that have to organize the licencing exam involving state university professors (the accredited ones) or have to make a contract for organizing the licencing exam in state universities (the only authorized ones). Post graduates studies started to be organized in private universities only after they have been accredited (according to the law) and consequently there are no advanced studies, as this is a postgraduate form that it is envisaged to be phase out from state higher education too. The Master programs have been marketed by private universities at very low tuition fees, lower with more than half the price from similar state university programs and much under their costs, probably for promotional reasons.
However the degree of heterogenity in the level of tuition fees is high, showing that usually there are used arbitrary ways of setting the tuition fees instead of more structured ways (such as based on the costs involved to train a student for a certain type of program, that should be similar between different universities). For instance, the level of tuition fees for the Bachelor degree varies at state universities from 100$/year to 700$/year and at private universities from 170$/year to 500$/year. Table no. 4.26. presents the minimum and the maximum levels of tuition fees for all types of programs.
Table no. 4.26. The minimum and the maximum levels of tuition fees
|
Programs |
Licence |
Advanced studies |
Master |
Doctorate |
||||
|
|
USD |
USD |
USD |
USD |
||||
|
|
min |
max |
min |
max |
min |
max |
min |
max |
|
State |
100 |
700 |
150 |
500 |
150 |
500 |
50 |
1000 |
|
Private |
170 |
500 |
0 |
0 |
150 |
150 |
300 |
300 |
|
Total |
100 |
700 |
150 |
500 |
150 |
500 |
50 |
1000 |
The level of costs was presented by most of the respondents in $, too and again the average level of anual cost/student was higher in state universities than in private universities, as presented in table no. 4.27.
Table 4.27. The level of anual costs/student for the academic year 2002-2003
|
Level
|
USD (costs) |
|||||||
|
State |
Private |
|||||||
|
Average |
% respondents |
N.r. |
% N.r. |
Average |
% respondents |
N.r. |
% N.r. |
|
|
Licence |
386 |
32,4% |
19 |
26,8% |
355 |
30,8% |
8 |
30,8% |
|
Advanced studies |
363 |
26,8% |
18 |
25,4% |
n.a. |
0,0% |
15 |
30,8% |
|
Master |
419 |
32,4% |
7 |
9,9% |
400 |
3,8% |
13 |
30,8% |
|
Doctorate |
456 |
11,3% |
20 |
28,2% |
500 |
3,8% |
13 |
30,8% |
|
TOTAL |
|
|
71 |
|
|
|
26 |
|
*) The difference up to 100% between respondents and non-respondents is represented by those who stated that they do not know to answer to this question and those who mentioned that it is not the case in their universities.
In both state and private universities the declared level of anual tuition fees/students is lower than the declared level of anual costs/student, indicating that both types of universities rely on other type of funds to sustain their academic activity (budgetary funds in state universities and sponsorships and donations in case of private universities).
Human resource activity in universities
Most of the respondents from state universities (88.7%) and all respondents from private universities (100%) stated that their university has a well defined policy for attracting young academics in their institutions. When asked about this policy the main means used that were mentioned were: ages (32% of the private respondents and 24% of the state respondents) and support them to finish their degrees such as Masters and Doctorates (16% in private universities and 44% of the state respondents). While, the wage was considered the main tool to attract new academics in private universities, in state universities the most imporatnt mean was the support given to young academics to continue their professional training. Respondents from both state and private universities mentioned (even though not asked) besides the two means used to attract new work force, also the conditions that such new work force should fulfil and the way the process should be organized. The emphasize was put on attracting good quality work force (32% of private respondents and 32% of the state respondents) and of using honest and independent selection procedure based on competition (20% of private respondents and 16% of the state respondents). This seems to be a sensitive issue as many of the respondents mentioned:
„Setting up national commissions for occupying the posts with the same members for the whole country, so that to eliminate the local nepotism”
or
„The elimination of the local commssions for promotions (that are corrupted and act based on influence traficking)”.
The factors of positive motivation and of negative motivation for academics were similar for respondents from state and from private universities. The positive motivators that scored the highest were „working with students” and the existance of a good material base”. See appendix no. 4.8. While the two reasons were scored by the vast majority of respondents from private universities (61.5%), the different positive motivations received from state university respondents were more equilibrated as percentages. It was a small percentage of respondents from state universities (7%) who stated that the wages do not represent a positive motivation factor, that came into contradiction to the results obtained in the case studies, when wages of academics were seen as being at shamely low levels and as a main demotivating factor. This reflects on the one hand that starting with the universitary autonomy, different universities share their funds differently between different categories of expenses, some of them placing less emphasize on remunerating the academics and consequently demotivating them strongly and others on the contrary placing more emphasize on remunarating academics and motivating them positively or at least keeping them content. On the other hand the fact that the survey envisaged only respondents with managerial positions in universities, those who make such salarial decisions, they might have preferred to see the wages as a positive motivational factor even when this is not (otherwise they would have to admit that they do have an unappropriate human resource policy regarding wages) in the institutions they manage.
Asked about the percentages of academics who do hold jobs outside their universities, it seems that academics from state universities work in larger percentages outside of their base institution, as compared to academics from private universities. See table no. 4.28. bellow. The reason may be that academics in private universities are better paid and they do not need to work outside to supplement their incomes as academics from state universities usually need, as well as the fact that human resource policies in private universities are more strict than in the case of state universities, not allowing academics to work outside their institution.
Table no. 4. 28. Proportion of academics who work outside their base institutions
|
No. |
Academics working outside university |
State |
Private |
||
|
No. |
% |
No. |
% |
||
|
|
Don’t know |
15 |
21.1% |
5 |
19.2% |
|
1. |
0-10% |
24 |
33.8% |
6 |
23.1% |
|
2. |
11-20% |
10 |
14.1% |
3 |
11.5% |
|
3. |
21-30% |
6 |
8.5% |
3 |
11.5% |
|
4. |
31-40% |
1 |
1.4% |
2 |
7.7% |
|
5. |
41-50% |
4 |
5.6% |
4 |
15.4% |
|
6. |
51-60% |
4 |
5.6% |
1 |
3.8% |
|
7. |
61-70% |
1 |
1.4% |
0 |
0.0% |
|
8. |
71-80% |
4 |
5.6% |
2 |
7.7% |
|
9. |
81-90% |
1 |
1.4% |
0 |
0.0% |
|
10. |
91-100% |
1 |
1.4% |
0 |
0.0% |
|
|
TOTAL |
71 |
|
26 |
|
Given the fact that the academic activity changed in Romanian universities after 1990, the nature of the decisions necessary to take at the level of academic management also changed to a certain extent. Therefore, training in new methods of decision making would be very helpful for present managerial teams to be able to cope succesfully with the new type of decisions. Most of the management members in both state universities (57.7%) and in private universities (57.7%) did not benefit of any type of management training, showing the possibility of existing weaknesses at this level for the implementation of the decentralization reform. Traditionally (before 1990), managers in universities in Romania had to take mainly operational decisions as most other were taken at higher levels (MER). At present universities’ management teams have to think their universities’ development strategies, that for some might be a diffcult task. It is less the case for private universities, where management had to take all types of decisions (academic and financial) from the very beginning of their existence. However, the fact that most managers of private universities originated from state higher education institutions, generated a high similarity of operations between the two types of institutions, this being reflected also by the popular belief that „private universities are only copies of the state universities”. Indeed the level of innovation in private universities was little, but this may also be explained by the fact that they had to build an appropriate material base, that usually the state universities would already have, letting little space for any other types of material or human investments that would bring real innovations to the higher education system in Romania.
The little percentage of those who did attend training programs in academic management, all stated that they felt a large and a very large utility from them.
Corruption in universities
Respondents were asked to indicate what is the extent of corruption at the level of students, of professors and of secretaries, under forms potentially possible to take place in universities. See appendices no. 4.9. to 4.11.
Students: Most of the respondents (around 70%) in both state and private universities stated that cheating at the admission exam does not exist in their university. Admission is one of the most strict exams in Romanian higher education (at least in the public sector), and its character was inherited from the past, as traditionally (before 1990) this was taking place at national level, was planned, coordinated and monitored by MER.
The most frequent form of student corruption both in state and private universities is cheating at exams during the study years, followed by buying already ellaborated esays or projects and buying final dissertations. This last phenomena seems to be more accentuated in private universities were 15.3% of the respondents stated that the proportion of students involved in this form of corruption is medium to large from 6% to over 30% of the students, while 34.6% of the respodents appreciated that under 5% of students are involved in such practices.
Admission and licencing exams are indeed processes more strictly organized (as we have seen previously) and monitored in both state and private universities and consequently are taking place more honestly. An influence is the fact that along faculty management, also university management and approval, planning and coordination from MER is taking place during these exams.
Proffesors: The results over the corruption of professors in state and private universities is similar. The main forms of corruption of professors are seen to be „influence traficking” and „receiving unsolicited presents from students”. See appendix no. 4.10. Twentyfour percent of the respondents in state universities stated that influence traficking takes place at a medium to large extent, while 49.3% appreciates that the process is taking place to a small and very small percentage. Similarly, 19.2% from private university respondents appreciated that influence traficking takes place at a medium and large extent and 42.3% appreciated that it takes place at a small and very small extent. The majority of the respondents acknowledge the existence of these practices in their institutions. A similar situation is encountered in the case of receiving unsolicited presents from students. In Romania offering small presents (coffee, cigarettes, chocolates, cosmetics, beverages) in different occasions in order to ease the process of obtaining what is needed has taken place traditionally for many years now. Based on this customary practice some students offer their professors such small presents, and it is possible that this can influence to a small extent the decision making of the professors and it is considered to be a form of corruption.
Secretaries: The
corruption at the level of secretaries is smaller in both state and private
universities, having as main forms: influencing the professors, receiving
presents from students and transcribing wrongly the marks in the centralizors.
See appendix no. 4.11.
The main ways indicated to combate corruption were: closer monitoring, constant control, instructions with personnel, high transparency of procedures. Specific measures in case of professors were hiring those with a high degree of morality and seriousness and stimulating them with the salaries so they would not be tempted. Specific measures in case of secretaries were besides transparency and introduction of IT in the secretarial work, the periodical rotation of secretaries. For students, the punitive measures (such as expelling) are used as examples to discourage such practices.
Orientation theory/practice. On overall the relationship between theory and practice was considered by most of the respondents (92.8%) to vary from 40% theory and the rest practice to 80% theory and the rest practice. See table no. 4. 29.
In state universities most respondents appreciated as the right proportion between theory and practice in their universities as being 50%/50% and 60% theory/40% practice (63.4%), while in private universities the perceived proportion between theory and practice was with a small percentage in the favour of theory (61.6% of the respondents appreciated that the relationship between theory and practice is 60% and 70% theory and the rest practice), meaning that there is still room for orienting private higher education institutions towards more practical knowledge content and teaching methods.
Table no. 4.29. Orientation towards theory/practice in Romanian universities
|
Theory |
Practice |
State + private |
State |
Private |
|||
|
No. |
% |
No. |
% |
No. |
% |
||
|
0% |
100% |
0 |
0.0% |
0 |
0.0% |
0 |
0.0% |
|
10% |
90% |
0 |
0.0% |
0 |
0.0% |
0 |
0.0% |
|
20% |
80% |
0 |
0.0% |
0 |
0.0% |
0 |
0.0% |
|
30% |
70% |
2 |
2.1% |
1 |
1.4% |
1 |
3.8% |
|
40% |
60% |
10 |
10.3% |
6 |
8.5% |
4 |
15.4% |
|
50% |
50% |
29 |
29.9% |
25 |
35.2% |
4 |
15.4% |
|
60% |
40% |
26 |
26.8% |
20 |
28.2% |
6 |
23.1% |
|
70% |
30% |
18 |
18.6% |
8 |
11.3% |
10 |
38.5% |
|
80% |
20% |
7 |
7.2% |
6 |
8.5% |
1 |
3.8% |
|
90% |
10% |
3 |
3.1% |
3 |
4.2% |
0 |
0.0% |
|
100% |
0% |
2 |
2.1% |
2 |
2.8% |
0 |
0.0% |
|
Others |
0 |
0% |
0 |
0% |
0 |
0% |
|
|
N.r. |
0 |
0% |
0 |
0% |
0 |
0% |
|
|
TOTAL |
97 |
|
|
71 |
|
26 |
|
Comparison state/ private higher
education
The respondents were asked to show the
degree of agreement or disagreenment with a number of statements some general
and some comparing state and private higher education. While at the general
statements, both state university respondents and private university
respondents had similar opinions, when the comparison was made between the two
types of higher education systems most respondents would appreciate positively
the type of higher education where they do opperate. See appendix no. 4.12.
For instance, while 71.8% of the respondents from the state universities disagree or strongly disagree with the statement „Generally speaking, the state HE has the same quality as the private HE”, 69.2% of the respondents from private universities agreed and strongly agreed with this statement. Similarly, while 71.8% of the respondents from state universities agreed and strongly agreed that „Professors at the state universities are better trained than the professors at private universities”, 61.5% from the professors from private universites disagreed and strongly disagreed. Similar responses were obtained in the case of comparing the seriousness of the activities in the two types of higher education institutions and also the degree of work required from the students in the two types of institutions. However, there were some aspects on which the answers from respondents of private universities were contradictory to a certain extent. For instance, talking about the material base in the two types of institutions, 30.8% of the private universities respondents agreed with the fact that the material base in state universities is better than in private universities while 46.2% disagreed and strongly disagreed. An explanation can be the degree of heterogenity of the material base in different private universities. Generally, private universities have the basic material base (buldings, classes and desks) new and of good quality but little innovation took place in terms of IT and multimedia equippment, for instance. Similarly, 38.5% of the respondents from private universities agreed that „High school graduates who go to state universities are better trained than those who go to private”, while 30.8% strongly disagreed. Admission exams were seen to be more difficult in state universities than in private universities by 42.3% respondents from private universities, while 26.9% disagreed.
Most respondents from both state (61.9%) and private (65.4%) universites agreed that „The firm’s participation in the Management Boards of universities can contribute to the improvement of HE”. There were however some who disagreed in both state (21.3%) and private (15.4%) universities, showing a less degree of openness for cooperation with the business community, one of the beneficicaries of the „products” of higher education.
In June 2003 a new Education Law was passed and at the time the survey was organized, the law was under ellaboration. The respondents were asked if they have participated to the ellaboration of the new law. The majority from both state (64.8%) and from private (50%) universities stated that they did not participate to the ellaboration of the new Education Law. This shows a centralized way of ellaborating legislative acts in Romania in the field of higher education, the low degree of involvement of those who have to implement the new regulations, denoting smaller chances of full succes of the new reglementations.
Evolution of the number of students and
of academics
The number of students varied from one faculty to another and from one type of program to another. Table no. 4.30. shows the number of students at faculty level for the year 2002-2003.
Table 4.30. The overall number of students at faculty level for the year 2002-2003
|
Faculty Level |
Day Classes |
Distance Learning |
Advanced studies |
Master |
Doctorate |
|||||
|
Number of students |
||||||||||
|
|
No |
% |
No |
% |
No |
% |
No |
% |
No |
% |
|
Fee paying students (state and private) |
|
|
|
|
|
|
|
|
|
|
|
under 100 students |
12 |
13,5% |
5 |
5,6% |
17 |
19,1% |
40 |
44,9% |
16 |
18,0% |
|
between 100 and 250 |
19 |
21,3% |
6 |
6,7% |
2 |
2,2% |
2 |
2,2% |
1 |
1,1% |
|
between 250 and 500 |
17 |
19,1% |
12 |
13,5% |
0 |
0,0% |
1 |
1,1% |
0 |
0,0% |
|
between 500 and 750 |
15 |
16,9% |
2 |
2,2% |
0 |
0,0% |
0 |
0,0% |
0 |
0,0% |
|
over 750 students |
12 |
13,5% |
7 |
7,9% |
0 |
0,0% |
0 |
0,0% |
0 |
0,0% |
|
N.r |
14 |
15,7% |
57 |
64,0% |
70 |
78,7% |
46 |
51,7% |
72 |
80,9% |
|
TOTAL answers |
75 |
84,3% |
32 |
36,0% |
19 |
21,3% |
43 |
48,3% |
17 |
19,1% |
|
TOTAL respondents |
89 |
|
89 |
|
89 |
|
89 |
|
89 |
|
|
Average no of students |
656 |
604 |
42 |
39 |
13 |
|||||
|
Budgetary students (state and private) |
|
|
|
|
|
|
|
|
|
|
|
under 100 students |
2 |
2,2% |
8 |
9,0% |
23 |
25,8% |
36 |
40,4% |
27 |
30,3% |
|
between 100 and 250 |
5 |
5,6% |
1 |
1,1% |
2 |
2,2% |
6 |
6,7% |
6 |
6,7% |
|
between 250 and 500 |
16 |
18,0% |
1 |
1,1% |
0 |
0,0% |
0 |
0,0% |
6 |
6,7% |
|
between 500 and 750 |
18 |
20,2% |
1 |
1,1% |
0 |
0,0% |
0 |
0,0% |
1 |
1,1% |
|
over 750 students |
20 |
22,5% |
1 |
1,1% |
0 |
0,0% |
0 |
0,0% |
0 |
0,0% |
|
N.r |
28 |
31,5% |
77 |
86,5% |
64 |
71,9% |
47 |
52,8% |
49 |
55,1% |
|
TOTAL answers |
61 |
68,5% |
12 |
13,5% |
25 |
28,1% |
42 |
47,2% |
40 |
44,9% |
|
TOTAL respondents |
89 |
|
89 |
|
89 |
|
89 |
|
89 |
|
|
Average no of students |
456 |
158 |
16 |
27 |
54 |
|||||
The situation is different in state universities as compared to private universities. Appendix no. 4.13. presents the number of students at faculty level for different type of programs in both state and private universities for the academic year 2002-2003. While in state universities the average number of fee paying students in day classes/faculty is 513, in private universities this is 800. However to the 513 fee paying students in state universities there are added the 827 average number/ faculty of budgetary students. There were also decalred a number of state budgeted students in private universities in the teological universities. Generally, state faculties enroll a higher number of students than private faculties at all types of programs.
At university level, the largest number of students are enrolled in day classes, 4731 on average as tuition fee paying students/university and 5792 as budgetary students/university, followed by distance learning students with an average of 5027 as tution fee paying students and only 202 as budgetary students. Most of the distance learning programs have been introduced in state universities, once the higher education reform was launched and they were allowed to organize tuition fee paying programs and to gather extra-budgetary funds.
Figures no. 4.1., 4.2. and 4.3. present the evolution of students after 1995 in state and private universities at the level of faculty. The general tendency was of increase in both state and private universities, with some variations in the case of distance learning classes and Masters programs. These programs have been introduced in state universities once, the universitary autonomy was introduced and state universities were allowed to collect extra-budgetary funds (such as from tution fees) and they have known an increased after 1999 when procedures for implementing academic and financial autonomy became more clearer. In private universities, distance learning had a continously ascendent trend, while Master programs started to be introduced only recently, the number of students being small but growing.
The number of academics employed in both state and private universities grew in the period 1995/1996 – 2001/2002, with around 45-55%, as presented in table no. 4.31. It was a high rate of non-response to this question (46.5% at state university respondents and 53.8% at private universities respondents), showing probably a lack of knowledge of the managerial staff over the overall situation of their academic staff.
Table no. 4.31. Evolution of the total number of academics in the period 1995/1995 – 2001/2002
|
Number of academics (all levels) |
TOTAL |
|||||
|
State |
Private |
State + private |
||||
|
No |
% |
No |
% |
No |
% |
|
|
1995-1996 |
|
|
|
|
|
|
|
Under 10 |
0 |
0,0% |
1 |
3,8% |
1 |
1,0% |
|
Between 10 and 20 |
5 |
7,0% |
3 |
11,5% |
8 |
8,2% |
|
Between 20 and 50 |
16 |
22,5% |
7 |
26,9% |
23 |
23,7% |
|
Between 50 and 75 |
4 |
5,6% |
0 |
0,0% |
4 |
4,1% |
|
Over 75 |
14 |
19,7% |
1 |
3,8% |
15 |
15,5% |
|
N.r |
32 |
45,1% |
14 |
53,8% |
46 |
47,4% |
|
TOTAL answers |
39 |
54,9% |
12 |
46,2% |
51 |
52,6% |
|
TOTAL respondents |
71 |
|
26 |
|
97 |
|
|
Average number
academics |
89 |
|
30 |
|
59 |
|
|
1996-1997 |
|
|
|
|
|
|
|
Under 10 |
0 |
0,0% |
1 |
3,8% |
1 |
1,0% |
|
Between 10 and 20 |
3 |
4,2% |
1 |
3,8% |
4 |
4,1% |
|
Between 20 and 50 |
17 |
23,9% |
8 |
30,8% |
25 |
25,8% |
|
Between 50 and 75 |
3 |
4,2% |
1 |
3,8% |
4 |
4,1% |
|
Over 75 |
15 |
21,1% |
1 |
3,8% |
16 |
16,5% |
|
N.r |
33 |
46,5% |
14 |
53,8% |
47 |
48,5% |
|
TOTAL answers |
38 |
53,5% |
12 |
46,2% |
50 |
51,5% |
|
TOTAL respondents |
71 |
|
26 |
|
97 |
|
|
Average number
of academics |
100 |
|
41 |
|
70 |
|
|
1997-1998 |
|
|
|
|
|
|
|
Under 10 |
0 |
0,0% |
0 |
0,0% |
0 |
0,0% |
|
Between 10 and 20 |
3 |
4,2% |
2 |
7,7% |
5 |
5,2% |
|
Between 20 and 50 |
17 |
23,9% |
7 |
26,9% |
24 |
24,7% |
|
Between 50 and 75 |
3 |
4,2% |
1 |
3,8% |
4 |
4,1% |
|
Over 75 |
15 |
21,1% |
2 |
7,7% |
17 |
17,5% |
|
N.r |
33 |
46,5% |
14 |
53,8% |
47 |
48,5% |
|
TOTAL answers |
38 |
53,5% |
12 |
46,2% |
50 |
51,5% |
|
TOTAL respondents |
71 |
|
26 |
|
97 |
|
|
Average number
of academics |
110 |
|
48 |
|
79 |
|
|
1998-1999 |
|
|
|
|
|
|
|
Under 10 |
0 |
0,0% |
0 |
0,0% |
0 |
0,0% |
|
Between 10 and 20 |
3 |
4,2% |
3 |
11,5% |
6 |
6,2% |
|
Between 20 and 50 |
14 |
19,7% |
5 |
19,2% |
19 |
19,6% |
|
Between 50 and 75 |
6 |
8,5% |
3 |
11,5% |
9 |
9,3% |
|
Over 75 |
15 |
21,1% |
3 |
11,5% |
18 |
18,6% |
|
N.r |
33 |
46,5% |
12 |
46,2% |
45 |
46,4% |
|
TOTAL answers |
38 |
53,5% |
14 |
53,8% |
52 |
53,6% |
|
TOTAL respondents |
71 |
|
26 |
|
97 |
|
|
Average number
of academics |
122 |
|
59 |
|
91 |
|
|
1999-2000 |
|
|
|
|
|
|
|
Under 10 |
0 |
0,0% |
0 |
0,0% |
0 |
0,0% |
|
Between 10 and 20 |
4 |
5,6% |
1 |
3,8% |
5 |
5,2% |
|
Between 20 and 50 |
12 |
16,9% |
10 |
38,5% |
22 |
22,7% |
|
Between 50 and 75 |
5 |
7,0% |
1 |
3,8% |
6 |
6,2% |
|
Over 75 |
18 |
25,4% |
3 |
11,5% |
21 |
21,6% |
|
N.r |
32 |
45,1% |
11 |
42,3% |
43 |
44,3% |
|
TOTAL answers |
39 |
54,9% |
15 |
57,7% |
54 |
55,7% |
|
TOTAL respondents |
71 |
|
26 |
|
97 |
|
|
Average number
of academics |
130 |
|
53 |
|
92 |
|
|
2000-2001 |
|
|
|
|
|
|
|
Under 10 |
0 |
0,0% |
1 |
3,8% |
1 |
1,0% |
|
Between 10 and 20 |
3 |
4,2% |
2 |
7,7% |
5 |
5,2% |
|
Between 20 and 50 |
13 |
18,3% |
9 |
34,6% |
22 |
22,7% |
|
Between 50 and 75 |
6 |
8,5% |
1 |
3,8% |
7 |
7,2% |
|
Over 75 |
17 |
23,9% |
3 |
11,5% |
20 |
20,6% |
|
N.r |
32 |
45,1% |
10 |
38,5% |
42 |
43,3% |
|
TOTAL answers |
39 |
54,9% |
16 |
61,5% |
55 |
56,7% |
|
TOTAL respondents |
71 |
|
26 |
|
97 |
|
|
Average number
of academics |
132 |
|
52 |
|
92 |
|
|
2001-2002 |
|
|
|
|
|
|
|
Under 10 |
0 |
0,0% |
0 |
0,0% |
0 |
0,0% |
|
Between 10 and 20 |
3 |
4,2% |
4 |
15,4% |
7 |
7,2% |
|
Between 20 and 50 |
13 |
18,3% |
8 |
30,8% |
21 |
21,6% |
|
Between 50 and 75 |
9 |
12,7% |
1 |
3,8% |
10 |
10,3% |
|
Over 75 |
18 |
25,4% |
3 |
11,5% |
21 |
21,6% |
|
N.r |
28 |
39,4% |
10 |
38,5% |
38 |
39,2% |
|
TOTAL answers |
43 |
60,6% |
16 |
61,5% |
59 |
60,8% |
|
TOTAL respondents |
71 |
|
26 |
|
97 |
|
|
Average number
of academics |
129 |
|
54 |
|
92 |
|
Figures no. 4.1. Evolution of the number of students in state universities (faculty level 1996-2002)
|
|
|
|
|
|
|
|
|
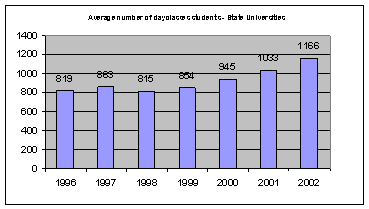
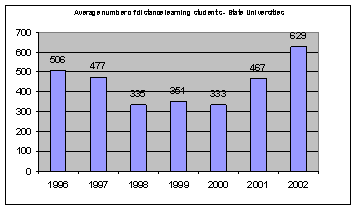
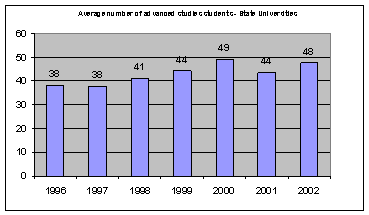
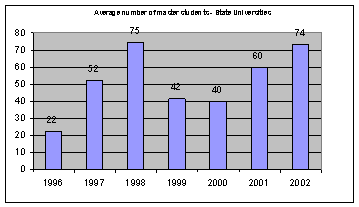
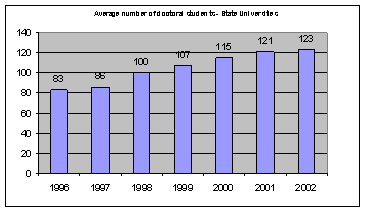
Figures 4.2. Evolution of the number of students in private universities (faculty level 1996 –
2002)
|
|
|
|
|
|
|
|
|
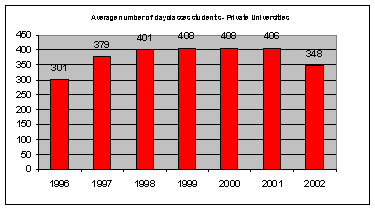
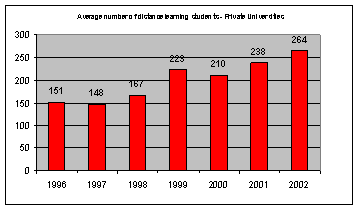
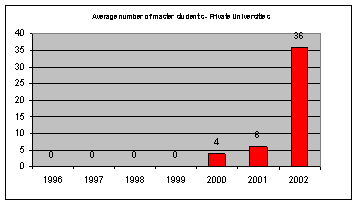
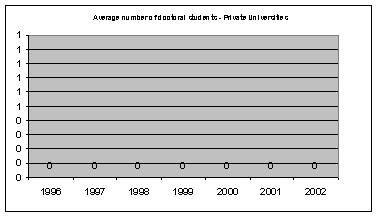
Figures 4.3.: Evolution of the number of students in state and private universities (faculty level 1996 – 2002)
|
|
|
|
|
|
|
|
|
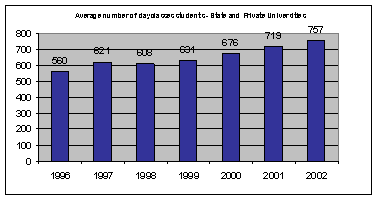
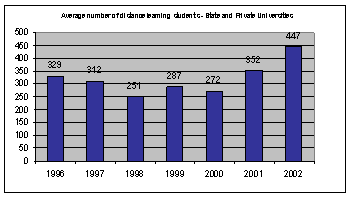
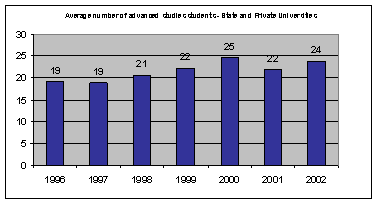
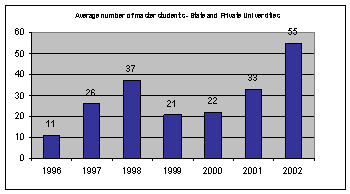
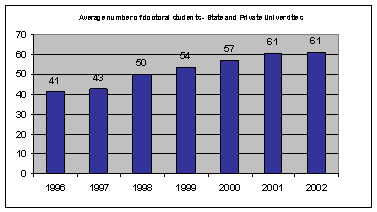
If in 1995/1996, state faculties had an average number of academics/faculty of 89 and private universities of 30, this number grew steadily, so that in 2001/2002 the average number of academics/faculty in state universities was 129 and in private universities was 92. Once the number of students increased, as we have seen, it was necessary to also increase the number of academics teaching the students. This is a sign of the continuous development of the higher education sector in Romania.
The number of state universities with a small number of academics decreased in this period. If for 1995/1996 there were 29.5% answers indicating a number of academics at faculty level under 50, in 2001/2002, only 22.5% respondents mentioned a total number of academics per faculty of 50 and less. At the same time, it increased the number of faculties with a larger number of academics per faculty. If in 1995/1996 there were only 14 respondents indicating a total number of academics/faculty over 75, in 2001/2002, there were 18 respondents indicating a total number of academics/faculty larger than 75.
The overall structure of academics on academic positions is similar in state and private universities, with small differences in the percentage of junior assitants and of lecturers. The percentage of junior assistants is higher in private universities (18%) than in state universites (12.7%), showing a higher degree of openess towards young people in private universities. On the other hand there is a question over the quality of the new young academics as some respondents (from state universities) considered that „private universities hire generally old retired academics and the young people they recruit are lowly trained”. The percenatge of lecturers is higher in state universities (28.5%) than in private universities (24.6%). Those from state universities are generally the young persons who have been hired immediately in the next years after 1990 when higher education opened again (after 15 years when no recruitments and very few promotions took place in this sector) hiring a large number of young academics. As it can be noticed in figures no. 4.4. the percentage of full time (work permitt) high level academics (professors and senior lecturers) is higher in state universities (38.8%) than in private universities (32,8%) reflecting a higher degree of experienced (but possibly outdated) people in state universities than in private universities. Private universities still suffer from the fact that the percentage of associated full professors is higher (20.9%) than the percentage of full time hired professors (16.4%), showing that these institutions still base their activity on borrowed work force.
Figures no. 4.4. Distribution of academics
|
|
|
|
|
|
|
|
|
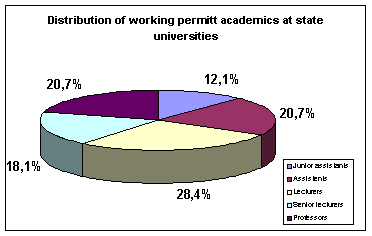
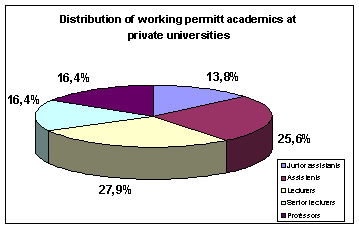
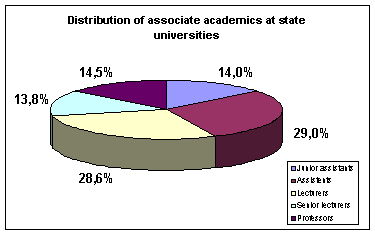
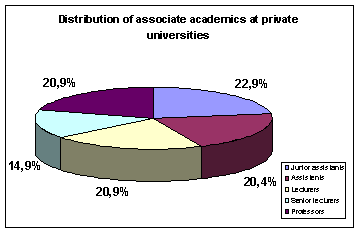
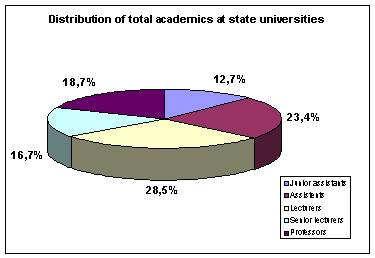
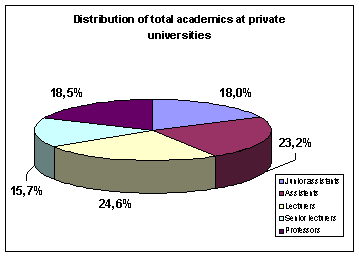
Asked about the main 3 changes that they would reccommend in order to improve higher education in Romania, respondents from state and private universities gave different answers as main priorities, as presented in table no. 4.32.
Table no. 4.32. The main 3 changes in the Romanian higher education system reccommended by respondents
|
No. |
Main 3 changes
reccommended |
State respondents |
No. |
Main 3 changes
reccommended |
Private respondents |
||||
|
No. |
% of answers |
% from total respondents |
No. |
% of answers |
% from total respondents |
||||
|
|
Total respondents/ rate
of response |
51 |
|
71.8% |
|
Total respondents/ rate
of response |
26 |
|
100% |
|
1. |
Changing
the financing system |
36 |
26% |
70.5% |
1. |
Non-discrimination
of state and private HE |
13 |
18% |
50% |
|
2. |
Introduce a real autonomy |
25 |
18% |
49% |
2. |
Higher flexibility in setting the curricula |
12 |
16% |
46.1% |
|
3. |
Changing the recruitment system, the quality of staff |
12 |
9% |
23.5% |
3. |
Rethinking the financing methods |
6 |
8% |
23% |
|
4. |
Adapting to international standards |
12 |
9% |
23.5% |
4. |
Adaptaing to international standards |
5 |
7% |
19.2% |
|
5. |
Increasing the quality of the educational act |
10 |
7% |
19.6% |
5. |
Increase in the quality of the educational act |
5 |
7% |
19,2% |
|
|
Others |
46 |
|
|
|
Others |
33 |
|
|
|
|
TOTAL alternatives |
141 |
|
|
|
TOTAL alternatives |
74 |
|
|
Academics from private higher education still feel discriminated as comparated to state higher education and therefore 50% mentioned as the main change needed to introduce „non-disciminatory practices, to change the mentality that is against private higher education, to sett common standards (eventhough this officially exists)”. One private respondent put it in a very constructive way:
„Private higher education should be given a larger coeficient of trust, they should not be seen by state universities and by MER as competitors, but they should be assimilated with aliates in the process of training the young generations of Romania”.
The issue that appears here is of completly different perspectives: while private universities see themselves as being perceived as competitors to state higher education and discriminated based on this reason, state universities see private universities as „their less prepared brothers” and the MER see private universities as not corresponding to the level of quality required in higher education and see the need of constantly monitoring and controlling them.
For the state universities the main issue remains the financing of different categories of expenses such as material base, personnel that is needed at a higher level, followed by an increased autonomy „not only on the paper” as said some.
In rest respondents from both state and private universities had similar suggestions related to the quality of the educational act and the adaptation to the international standards.
Appendix no. 4.1. Map of Romania

Appendix no. 4.2. The number of accredited faculties in state and private universities
|
Number of faculties |
Total no. of
faculties within an university |
% of respon. |
No. of acredied faculties |
% of respon. |
% of the accredited
faculties in the total no. of faculties |
State |
Private |
||||||||
|
Total faculties |
% of respon. |
No. of acredited faculties |
% of respon. |
% of accredited
faculties in the total no. of faculties |
Total faculties |
% of respon. |
No. of accredited faculties |
% of respon. |
% of accredited faculties in the total no. of
faculties |
||||||
|
1 |
2 |
2,1% |
2 |
2,1% |
50,48% |
0 |
2,1% |
0 |
0,0% |
na |
2 |
7,7% |
2 |
7,7% |
50,5% |
|
2 |
1 |
1,0% |
1 |
1,0% |
na |
0 |
1,0% |
0 |
0,0% |
na |
1 |
3,8% |
1 |
3,8% |
na |
|
3 |
3 |
3,1% |
3 |
3,1% |
83,33% |
1 |
3,1% |
1 |
1,4% |
100,0% |
2 |
7,7% |
2 |
7,7% |
80,0% |
|
4 |
6 |
6,2% |
6 |
6,2% |
50,79% |
0 |
6,2% |
0 |
0,0% |
na |
6 |
23,1% |
6 |
23,1% |
50,8% |
|
5 |
2 |
2,1% |
2 |
2,1% |
72,73% |
1 |
2,1% |
1 |
1,4% |
72,7% |
1 |
3,8% |
1 |
3,8% |
na |
|
6 |
2 |
2,1% |
2 |
2,1% |
79,17% |
2 |
2,1% |
2 |
2,8% |
91,7% |
0 |
0,0% |
0 |
0,0% |
73,8% |
|
7 |
1 |
1,0% |
1 |
1,0% |
56,16% |
0 |
1,0% |
0 |
0,0% |
77,8% |
1 |
3,8% |
1 |
3,8% |
45,3% |
|
8 |
8 |
8,2% |
8 |
8,2% |
80,00% |
1 |
8,2% |
1 |
1,4% |
80,0% |
7 |
26,9% |
7 |
26,9% |
na |
|
9 |
7 |
7,2% |
7 |
7,2% |
100,00% |
5 |
7,2% |
5 |
7,0% |
100,0% |
2 |
7,7% |
2 |
7,7% |
na |
|
10 |
5 |
5,2% |
5 |
5,2% |
89,29% |
5 |
5,2% |
5 |
7,0% |
97,7% |
0 |
0,0% |
0 |
0,0% |
55,6% |
|
Over 10 |
49 |
50,5% |
49 |
50,5% |
97,7% |
46 |
50,5% |
46 |
64,8% |
97,7% |
3 |
11,5% |
3 |
11,5% |
na |
|
N.r. |
11 |
11,3% |
11 |
11,3% |
- |
10 |
11,3% |
10 |
14,1% |
- |
1 |
3,8% |
1 |
3,8% |
- |
|
TOTAL |
97 |
100,0% |
97 |
100,0% |
- |
71 |
100,0% |
71 |
100,0% |
- |
26 |
100,0% |
26 |
100,0% |
- |
|
Average no. of faculties |
12 |
- |
11 |
- |
85,7% |
14 |
|
14 |
- |
95,8% |
7 |
|
4 |
- |
63,2% |
Appendix no. 4.3. MEC and its roles in the university
activities
|
Activity |
Initiative (I) |
Approval (A) |
Planning (P) |
Coordination (C) |
Implementation (Im) |
Monitoring (M) |
Advice (S) |
|||||||||||||||||||||
|
|
No |
% |
Nr |
Tot |
No |
% |
Nr |
Tot |
N |
% |
Nr |
Tot |
No |
% |
Nr |
Tot |
N |
% |
Nr |
Tot |
N |
% |
Nr |
Tot |
N |
% |
Nr |
Tot |
|
Admittance |
|
|
|
|
|
|
|
|
|
|
|
|
|
|
|
|
|
|
|
|
|
|
|
|
|
|
|
|
|
- evaluation criteria |
12 |
12,4% |
41 |
53 |
22 |
22,7% |
41 |
63 |
7 |
7,2% |
41 |
48 |
10 |
10,3% |
41 |
51 |
1 |
1,0% |
41 |
42 |
9 |
9,3% |
41 |
50 |
0 |
0,0% |
41 |
41 |
|
- process |
8 |
8,2% |
50 |
58 |
18 |
18,6% |
50 |
68 |
7 |
7,2% |
50 |
57 |
13 |
13,4% |
50 |
63 |
0 |
0,0% |
50 |
50 |
6 |
6,2% |
50 |
56 |
0 |
0,0% |
50 |
50 |
|
Licencing |
|
|
|
|
|
|
|
|
|
|
|
|
|
|
|
|
|
|
|
|
|
|
|
|
|
|
|
|
|
- criteria |
10 |
10,3% |
38 |
48 |
27 |
27,8% |
38 |
65 |
11 |
11,3% |
38 |
49 |
15 |
15,5% |
38 |
53 |
8 |
8,2% |
38 |
46 |
4 |
4,1% |
38 |
42 |
0 |
0,0% |
38 |
38 |
|
- process |
8 |
8,2% |
51 |
59 |
18 |
18,6% |
51 |
69 |
7 |
7,2% |
51 |
58 |
13 |
13,4% |
51 |
64 |
3 |
3,1% |
51 |
54 |
6 |
6,2% |
51 |
57 |
1 |
1,0% |
51 |
52 |
|
Recruitment |
2 |
2,1% |
65 |
67 |
22 |
22,7% |
65 |
87 |
4 |
4,1% |
65 |
69 |
6 |
6,2% |
65 |
71 |
0 |
0,0% |
65 |
65 |
2 |
2,1% |
65 |
67 |
0 |
0,0% |
65 |
65 |
|
Promotions |
|
|
|
|
|
|
|
|
|
|
|
|
|
|
|
|
|
|
|
|
|
|
|
|
|
|
|
|
|
- criteria |
9 |
9,3% |
42 |
51 |
33 |
34,0% |
42 |
75 |
6 |
6,2% |
42 |
48 |
11 |
11,3% |
42 |
53 |
3 |
3,1% |
42 |
45 |
3 |
3,1% |
42 |
45 |
1 |
1,0% |
42 |
43 |
|
- process |
4 |
4,1% |
51 |
55 |
34 |
35,1% |
51 |
85 |
3 |
3,1% |
51 |
54 |
9 |
9,3% |
51 |
60 |
1 |
1,0% |
51 |
52 |
0 |
0,0% |
51 |
51 |
1 |
1,0% |
51 |
52 |
|
Setting the wages |
11 |
11,3% |
61 |
72 |
8 |
8,2% |
61 |
69 |
2 |
2,1% |
61 |
63 |
9 |
9,3% |
61 |
70 |
4 |
4,1% |
61 |
65 |
6 |
6,2% |
61 |
67 |
0 |
0,0% |
61 |
61 |
|
Dismissal |
3 |
3,1% |
83 |
86 |
6 |
6,2% |
83 |
89 |
0 |
0,0% |
83 |
83 |
2 |
2,1% |
83 |
85 |
0 |
0,0% |
83 |
83 |
3 |
3,1% |
83 |
86 |
0 |
0,0% |
83 |
83 |
|
Sett the curricula |
4 |
4,1% |
57 |
61 |
20 |
20,6% |
57 |
77 |
4 |
4,1% |
57 |
61 |
14 |
14,4% |
57 |
71 |
0 |
0,0% |
57 |
57 |
2 |
2,1% |
57 |
59 |
0 |
0,0% |
57 |
57 |
|
Sett course outline |
2 |
2,1% |
72 |
74 |
7 |
7,2% |
72 |
79 |
5 |
5,2% |
72 |
77 |
10 |
10,3% |
72 |
82 |
0 |
0,0% |
72 |
72 |
2 |
2,1% |
72 |
74 |
0 |
0,0% |
72 |
72 |
|
Sett the enrolment figure |
5 |
5,2% |
18 |
23 |
64 |
66,0% |
18 |
82 |
3 |
3,1% |
18 |
21 |
9 |
9,3% |
18 |
27 |
7 |
7,2% |
18 |
25 |
2 |
2,1% |
18 |
20 |
0 |
0,0% |
18 |
18 |
|
Sett the budget of the university |
6 |
6,2% |
46 |
52 |
36 |
37,1% |
46 |
82 |
5 |
5,2% |
46 |
51 |
8 |
8,2% |
46 |
54 |
6 |
6,2% |
46 |
52 |
1 |
1,0% |
46 |
47 |
0 |
0,0% |
46 |
46 |
|
Sett the budget of the faculty |
0 |
0,0% |
77 |
77 |
11 |
11,3% |
77 |
88 |
1 |
1,0% |
77 |
78 |
3 |
3,1% |
77 |
80 |
1 |
1,0% |
77 |
78 |
4 |
4,1% |
77 |
81 |
0 |
0,0% |
77 |
77 |
|
Introducing new academic programs |
1 |
1,0% |
69 |
70 |
18 |
18,6% |
69 |
87 |
0 |
0,0% |
69 |
69 |
7 |
7,2% |
69 |
76 |
0 |
0,0% |
69 |
69 |
2 |
2,1% |
69 |
71 |
0 |
0,0% |
69 |
69 |
|
Introducing new disciplines |
1 |
1,0% |
76 |
77 |
9 |
9,3% |
76 |
85 |
0 |
0,0% |
76 |
76 |
8 |
8,2% |
76 |
84 |
0 |
0,0% |
76 |
76 |
3 |
3,1% |
76 |
79 |
0 |
0,0% |
76 |
76 |
|
Give up some disciplines |
1 |
1,0% |
79 |
80 |
5 |
5,2% |
79 |
84 |
1 |
1,0% |
79 |
80 |
8 |
8,2% |
79 |
87 |
0 |
0,0% |
79 |
79 |
3 |
3,1% |
79 |
82 |
0 |
0,0% |
79 |
79 |
|
Evaluation of students |
3 |
3,1% |
78 |
81 |
2 |
2,1% |
78 |
80 |
2 |
2,1% |
78 |
80 |
8 |
8,2% |
78 |
86 |
0 |
0,0% |
78 |
78 |
5 |
5,2% |
78 |
83 |
0 |
0,0% |
78 |
78 |
|
Evaluation of academics by students |
0 |
0,0% |
88 |
88 |
0 |
0,0% |
88 |
88 |
2 |
2,1% |
88 |
90 |
2 |
2,1% |
88 |
90 |
0 |
0,0% |
88 |
88 |
5 |
5,2% |
88 |
93 |
0 |
0,0% |
88 |
88 |
Appendix no. 4. 4. Rectorates and their roles in the university activities
|
Activity |
Initiative (I) |
Approval (A) |
Planning (P) |
Coordination (C) |
Implementation (Im) |
Monitoring (M) |
Advice (S) |
|||||||||||||||||||||
|
|
No |
% |
Nr |
Tot |
No |
% |
Nr |
Tot |
No |
% |
Nr |
Tot |
No |
% |
Nr |
Tot |
No |
% |
Nr |
Tot |
No |
% |
Nr |
Tot |
No |
% |
Nr |
Tot |
|
Admittance |
|
|
|
|
|
|
|
|
|
|
|
|
|
|
|
|
|
|
|
|
|
|
|
|
|
|
|
|
|
- evaluation criteria |
9 |
9,3% |
18 |
27 |
50 |
51,5% |
18 |
68 |
20 |
20,6% |
18 |
38 |
26 |
26,8% |
18 |
44 |
5 |
5,2% |
18 |
23 |
4 |
4,1% |
18 |
22 |
2 |
2,1% |
18 |
20 |
|
- process |
7 |
7,2% |
19 |
26 |
36 |
37,1% |
19 |
55 |
24 |
24,7% |
19 |
43 |
36 |
37,1% |
19 |
55 |
9 |
9,3% |
19 |
28 |
5 |
5,2% |
19 |
24 |
1 |
1,0% |
19 |
20 |
|
Licencing |
|
|
|
|
|
|
|
|
|
|
|
|
|
|
|
|
|
|
|
|
|
|
|
|
|
|
|
|
|
- criteria |
9 |
9,3% |
25 |
34 |
37 |
38,1% |
25 |
62 |
16 |
16,5% |
25 |
41 |
27 |
27,8% |
25 |
52 |
5 |
5,2% |
25 |
30 |
3 |
3,1% |
25 |
28 |
5 |
5,2% |
25 |
30 |
|
- process |
0 |
0,0% |
30 |
30 |
0 |
0,0% |
30 |
30 |
0 |
0,0% |
30 |
30 |
0 |
0,0% |
30 |
30 |
0 |
0,0% |
30 |
30 |
0 |
0,0% |
30 |
30 |
0 |
0,0% |
30 |
30 |
|
Recruitment |
8 |
8,2% |
16 |
24 |
66 |
68,0% |
16 |
82 |
10 |
10,3% |
16 |
26 |
14 |
14,4% |
16 |
30 |
5 |
5,2% |
16 |
21 |
1 |
1,0% |
16 |
17 |
6 |
6,2% |
16 |
22 |
|
Promotions |
|
|
|
|
|
|
|
|
|
|
|
|
|
|
|
|
|
|
|
|
|
|
|
|
|
|
|
|
|
- criteria |
13 |
13,4% |
17 |
30 |
51 |
52,6% |
17 |
68 |
17 |
17,5% |
17 |
34 |
15 |
15,5% |
17 |
32 |
10 |
10,3% |
17 |
27 |
1 |
1,0% |
17 |
18 |
5 |
5,2% |
17 |
22 |
|
- process |
9 |
9,3% |
14 |
23 |
51 |
52,6% |
14 |
65 |
24 |
24,7% |
14 |
38 |
22 |
22,7% |
14 |
36 |
13 |
13,4% |
14 |
27 |
0 |
0,0% |
14 |
14 |
5 |
5,2% |
14 |
19 |
|
Setting the wages |
22 |
22,7% |
11 |
33 |
60 |
61,9% |
11 |
71 |
10 |
10,3% |
11 |
21 |
14 |
14,4% |
11 |
25 |
11 |
11,3% |
11 |
22 |
0 |
0,0% |
11 |
11 |
11 |
11,3% |
11 |
22 |
|
Dismissal |
14 |
14,4% |
36 |
50 |
50 |
51,5% |
36 |
86 |
5 |
5,2% |
36 |
41 |
8 |
8,2% |
36 |
44 |
4 |
4,1% |
36 |
40 |
0 |
0,0% |
36 |
36 |
4 |
4,1% |
36 |
40 |
|
Sett the curricula |
5 |
5,2% |
18 |
23 |
66 |
68,0% |
18 |
84 |
12 |
12,4% |
18 |
30 |
14 |
14,4% |
18 |
32 |
4 |
4,1% |
18 |
22 |
3 |
3,1% |
18 |
21 |
3 |
3,1% |
18 |
21 |
|
Sett course outline |
3 |
3,1% |
49 |
52 |
27 |
27,8% |
49 |
76 |
9 |
9,3% |
49 |
58 |
11 |
11,3% |
49 |
60 |
3 |
3,1% |
49 |
52 |
3 |
3,1% |
49 |
52 |
2 |
2,1% |
49 |
51 |
|
Sett the enrolment figure |
16 |
16,5% |
14 |
30 |
46 |
47,4% |
14 |
60 |
22 |
22,7% |
14 |
36 |
12 |
12,4% |
14 |
26 |
17 |
17,5% |
14 |
31 |
1 |
1,0% |
14 |
15 |
5 |
5,2% |
14 |
19 |
|
Sett the budget of the university |
24 |
24,7% |
24 |
48 |
29 |
29,9% |
24 |
53 |
17 |
17,5% |
24 |
41 |
16 |
16,5% |
24 |
40 |
34 |
35,1% |
24 |
58 |
1 |
1,0% |
24 |
25 |
10 |
10,3% |
24 |
34 |
|
Sett the budget of the faculty |
10 |
10,3% |
27 |
37 |
53 |
54,6% |
27 |
80 |
18 |
18,6% |
27 |
45 |
17 |
17,5% |
27 |
44 |
16 |
16,5% |
27 |
43 |
1 |
1,0% |
27 |
28 |
4 |
4,1% |
27 |
31 |
|
Introducing new academic programs |
8 |
8,2% |
33 |
41 |
53 |
54,6% |
33 |
86 |
9 |
9,3% |
33 |
42 |
12 |
12,4% |
33 |
45 |
5 |
5,2% |
33 |
38 |
2 |
2,1% |
33 |
35 |
3 |
3,1% |
33 |
36 |
|
Introducing new disciplines |
5 |
5,2% |
44 |
49 |
45 |
46,4% |
44 |
89 |
6 |
6,2% |
44 |
50 |
10 |
10,3% |
44 |
54 |
2 |
2,1% |
44 |
46 |
2 |
2,1% |
44 |
46 |
3 |
3,1% |
44 |
47 |
|
Give up some disciplines |
3 |
3,1% |
52 |
55 |
36 |
37,1% |
52 |
88 |
4 |
4,1% |
52 |
56 |
9 |
9,3% |
52 |
61 |
1 |
1,0% |
52 |
53 |
3 |
3,1% |
52 |
55 |
2 |
2,1% |
52 |
54 |
|
Evaluation of students |
4 |
4,1% |
54 |
58 |
26 |
26,8% |
54 |
80 |
10 |
10,3% |
54 |
64 |
14 |
14,4% |
54 |
68 |
2 |
2,1% |
54 |
56 |
4 |
4,1% |
54 |
58 |
3 |
3,1% |
54 |
57 |
|
Evaluation of academics by students |
14 |
14,4% |
60 |
74 |
16 |
16,5% |
60 |
76 |
11 |
11,3% |
60 |
71 |
7 |
7,2% |
60 |
67 |
3 |
3,1% |
60 |
63 |
0 |
0,0% |
60 |
60 |
3 |
3,1% |
60 |
63 |
Appendix no. 4.5. Decanates and their roles in the university activities
|
Activity |
Initiative (I) |
Approval (A) |
Planning (P) |
Coordination (C) |
Implementation (Im) |
Monitoring (M) |
Advice (S) |
|||||||||||||||||||||
|
|
No |
% |
Nr |
Tot |
No |
% |
Nr |
Tot |
No |
% |
Nr |
Tot |
No |
% |
Nr |
Tot |
No |
% |
Nr |
Tot |
No |
% |
Nr |
Tot |
No |
% |
Nr |
Tot |
|
Admittance |
|
|
|
|
|
|
|
|
|
|
|
|
|
|
|
|
|
|
|
|
|
|
|
|
|
|
|
|
|
- evaluation criteria |
43 |
44,3% |
17 |
60 |
12 |
12,4% |
17 |
29 |
26 |
26,8% |
17 |
43 |
8 |
8,2% |
17 |
25 |
20 |
20,6% |
17 |
37 |
2 |
2,1% |
17 |
19 |
19 |
19,6% |
17 |
36 |
|
- process |
28 |
28,9% |
17 |
45 |
6 |
6,2% |
17 |
23 |
38 |
39,2% |
17 |
55 |
17 |
17,5% |
17 |
34 |
23 |
23,7% |
17 |
40 |
0 |
0,0% |
17 |
17 |
26 |
26,8% |
17 |
43 |
|
Licencing |
|
|
|
|
|
|
|
|
|
|
|
|
|
|
|
|
|
|
|
|
|
|
|
|
|
|
|
|
|
- criteria |
30 |
30,9% |
22 |
52 |
15 |
15,5% |
22 |
37 |
26 |
26,8% |
22 |
48 |
18 |
18,6% |
22 |
40 |
18 |
18,6% |
22 |
40 |
0 |
0,0% |
22 |
22 |
16 |
16,5% |
22 |
38 |
|
- process |
18 |
18,6% |
20 |
38 |
8 |
8,2% |
20 |
28 |
39 |
40,2% |
20 |
59 |
22 |
22,7% |
20 |
42 |
27 |
27,8% |
20 |
47 |
1 |
1,0% |
20 |
21 |
22 |
22,7% |
20 |
42 |
|
Recruitment |
38 |
39,2% |
22 |
60 |
20 |
20,6% |
22 |
42 |
16 |
16,5% |
22 |
38 |
8 |
8,2% |
22 |
30 |
17 |
17,5% |
22 |
39 |
4 |
4,1% |
22 |
26 |
10 |
10,3% |
22 |
32 |
|
Promotions |
|
|
|
|
|
|
|
|
|
|
|
|
|
|
|
|
|
|
|
|
|
|
|
|
|
|
|
|
|
- criteria |
32 |
33,0% |
20 |
52 |
23 |
23,7% |
20 |
43 |
20 |
20,6% |
20 |
40 |
10 |
10,3% |
20 |
30 |
19 |
19,6% |
20 |
39 |
6 |
6,2% |
20 |
26 |
10 |
10,3% |
20 |
30 |
|
- process |
23 |
23,7% |
17 |
40 |
21 |
21,6% |
17 |
38 |
26 |
26,8% |
17 |
43 |
19 |
19,6% |
17 |
36 |
22 |
22,7% |
17 |
39 |
1 |
1,0% |
17 |
18 |
16 |
16,5% |
17 |
33 |
|
Setting the wages |
27 |
27,8% |
33 |
60 |
8 |
8,2% |
33 |
41 |
12 |
12,4% |
33 |
45 |
8 |
8,2% |
33 |
41 |
20 |
20,6% |
33 |
53 |
8 |
8,2% |
33 |
41 |
12 |
12,4% |
33 |
45 |
|
Dismissal |
18 |
18,6% |
46 |
64 |
15 |
15,5% |
46 |
61 |
7 |
7,2% |
46 |
53 |
3 |
3,1% |
46 |
49 |
5 |
5,2% |
46 |
51 |
5 |
5,2% |
46 |
51 |
13 |
13,4% |
46 |
59 |
|
Sett the curricula |
37 |
38,1% |
12 |
49 |
24 |
24,7% |
12 |
36 |
23 |
23,7% |
12 |
35 |
15 |
15,5% |
12 |
27 |
23 |
23,7% |
12 |
35 |
4 |
4,1% |
12 |
16 |
17 |
17,5% |
12 |
29 |
|
Sett course outline |
19 |
19,6% |
13 |
32 |
42 |
43,3% |
13 |
55 |
19 |
19,6% |
13 |
32 |
20 |
20,6% |
13 |
33 |
15 |
15,5% |
13 |
28 |
2 |
2,1% |
13 |
15 |
9 |
9,3% |
13 |
22 |
|
Sett the enrolment figure |
56 |
57,7% |
17 |
73 |
9 |
9,3% |
17 |
26 |
7 |
7,2% |
17 |
24 |
6 |
6,2% |
17 |
23 |
19 |
19,6% |
17 |
36 |
2 |
2,1% |
17 |
19 |
21 |
21,6% |
17 |
38 |
|
Sett the budget of the university |
18 |
18,6% |
56 |
74 |
5 |
5,2% |
56 |
61 |
5 |
5,2% |
56 |
61 |
5 |
5,2% |
56 |
61 |
8 |
8,2% |
56 |
64 |
12 |
12,4% |
56 |
68 |
10 |
10,3% |
56 |
66 |
|
Sett the budget of the faculty |
31 |
32,0% |
37 |
68 |
15 |
15,5% |
37 |
52 |
13 |
13,4% |
37 |
50 |
10 |
10,3% |
37 |
47 |
23 |
23,7% |
37 |
60 |
2 |
2,1% |
37 |
39 |
15 |
15,5% |
37 |
52 |
|
Introducing new academic programs |
38 |
39,2% |
17 |
55 |
24 |
24,7% |
17 |
41 |
25 |
25,8% |
17 |
42 |
13 |
13,4% |
17 |
30 |
22 |
22,7% |
17 |
39 |
1 |
1,0% |
17 |
18 |
22 |
22,7% |
17 |
39 |
|
Introducing new disciplines |
33 |
34,0% |
13 |
46 |
39 |
40,2% |
13 |
52 |
24 |
24,7% |
13 |
37 |
11 |
11,3% |
13 |
24 |
17 |
17,5% |
13 |
30 |
3 |
3,1% |
13 |
16 |
16 |
16,5% |
13 |
29 |
|
Give up some disciplines |
31 |
32,0% |
22 |
53 |
34 |
35,1% |
22 |
56 |
25 |
25,8% |
22 |
47 |
11 |
11,3% |
22 |
33 |
13 |
13,4% |
22 |
35 |
3 |
3,1% |
22 |
25 |
9 |
9,3% |
22 |
31 |
|
Evaluation of students |
24 |
24,7% |
20 |
44 |
31 |
32,0% |
20 |
51 |
28 |
28,9% |
20 |
48 |
18 |
18,6% |
20 |
38 |
13 |
13,4% |
20 |
33 |
6 |
6,2% |
20 |
26 |
12 |
12,4% |
20 |
32 |
|
Evaluation of academics by students |
31 |
32,0% |
37 |
68 |
10 |
10,3% |
37 |
47 |
15 |
15,5% |
37 |
52 |
15 |
15,5% |
37 |
52 |
5 |
5,2% |
37 |
42 |
2 |
2,1% |
37 |
39 |
22 |
22,7% |
37 |
59 |
Appendix no. 4.6. Head of departments and their roles in the university activities
|
Activity |
Initiative (I) |
Approval (A) |
Planning (P) |
Coordination (C) |
Implementation (Im) |
Monitoring (M) |
Advice (S) |
|||||||||||||||||||||
|
|
No |
% |
Nr |
Tot |
No |
% |
Nr |
Tot |
No |
% |
Nr |
Tot |
No |
% |
Nr |
Tot |
No |
% |
Nr |
Tot |
No |
% |
Nr |
Tot |
No |
% |
Nr |
Tot |
|
Admittance |
|
|
|
|
|
|
|
|
|
|
|
|
|
|
|
|
|
|
|
|
|
|
|
|
|
|
|
|
|
- evaluation criteria |
21 |
21,6% |
40 |
61 |
1 |
1,0% |
40 |
41 |
5 |
5,2% |
40 |
45 |
2 |
2,1% |
40 |
42 |
2 |
2,1% |
40 |
42 |
21 |
21,6% |
40 |
61 |
14 |
14,4% |
40 |
54 |
|
- process |
16 |
16,5% |
44 |
60 |
1 |
1,0% |
44 |
45 |
5 |
5,2% |
44 |
49 |
3 |
3,1% |
44 |
47 |
2 |
2,1% |
44 |
46 |
18 |
18,6% |
44 |
62 |
16 |
16,5% |
44 |
60 |
|
Licencing |
|
|
|
|
|
|
|
|
|
|
|
|
|
|
|
|
|
|
|
|
|
|
|
|
|
|
|
|
|
- criteria |
22 |
22,7% |
34 |
56 |
2 |
2,1% |
34 |
36 |
8 |
8,2% |
34 |
42 |
8 |
8,2% |
34 |
42 |
6 |
6,2% |
34 |
40 |
17 |
17,5% |
34 |
51 |
19 |
19,6% |
34 |
53 |
|
- process |
13 |
13,4% |
42 |
55 |
2 |
2,1% |
42 |
44 |
9 |
9,3% |
42 |
51 |
7 |
7,2% |
42 |
49 |
7 |
7,2% |
42 |
49 |
11 |
11,3% |
42 |
53 |
20 |
20,6% |
42 |
62 |
|
Recruitment |
25 |
25,8% |
39 |
64 |
5 |
5,2% |
39 |
44 |
5 |
5,2% |
39 |
44 |
1 |
1,0% |
39 |
40 |
8 |
8,2% |
39 |
47 |
20 |
20,6% |
39 |
59 |
11 |
11,3% |
39 |
50 |
|
Promotions |
|
|
|
|
|
|
|
|
|
|
|
|
|
|
|
|
|
|
|
|
|
|
|
|
|
|
|
|
|
- criteria |
29 |
29,9% |
28 |
57 |
7 |
7,2% |
28 |
35 |
3 |
3,1% |
28 |
31 |
7 |
7,2% |
28 |
35 |
15 |
15,5% |
28 |
43 |
14 |
14,4% |
28 |
42 |
10 |
10,3% |
28 |
38 |
|
- process |
26 |
26,8% |
25 |
51 |
4 |
4,1% |
25 |
29 |
4 |
4,1% |
25 |
29 |
9 |
9,3% |
25 |
34 |
13 |
13,4% |
25 |
38 |
13 |
13,4% |
25 |
38 |
19 |
19,6% |
25 |
44 |
|
Setting the wages |
20 |
20,6% |
51 |
71 |
2 |
2,1% |
51 |
53 |
4 |
4,1% |
51 |
55 |
3 |
3,1% |
51 |
54 |
5 |
5,2% |
51 |
56 |
14 |
14,4% |
51 |
65 |
8 |
8,2% |
51 |
59 |
|
Dismissal |
18 |
18,6% |
55 |
73 |
8 |
8,2% |
55 |
63 |
1 |
1,0% |
55 |
56 |
4 |
4,1% |
55 |
59 |
4 |
4,1% |
55 |
59 |
8 |
8,2% |
55 |
63 |
8 |
8,2% |
55 |
63 |
|
Sett the curricula |
31 |
32,0% |
21 |
52 |
6 |
6,2% |
21 |
27 |
11 |
11,3% |
21 |
32 |
10 |
10,3% |
21 |
31 |
11 |
11,3% |
21 |
32 |
14 |
14,4% |
21 |
35 |
18 |
18,6% |
21 |
39 |
|
Sett course outline |
25 |
25,8% |
18 |
43 |
17 |
17,5% |
18 |
35 |
24 |
24,7% |
18 |
42 |
14 |
14,4% |
18 |
32 |
16 |
16,5% |
18 |
34 |
7 |
7,2% |
18 |
25 |
18 |
18,6% |
18 |
36 |
|
Sett the enrolment figure |
17 |
17,5% |
51 |
68 |
2 |
2,1% |
51 |
53 |
1 |
1,0% |
51 |
52 |
4 |
4,1% |
51 |
55 |
5 |
5,2% |
51 |
56 |
20 |
20,6% |
51 |
71 |
2 |
2,1% |
51 |
53 |
|
Sett the budget of the university |
6 |
6,2% |
78 |
84 |
2 |
2,1% |
78 |
80 |
2 |
2,1% |
78 |
80 |
1 |
1,0% |
78 |
79 |
3 |
3,1% |
78 |
81 |
14 |
14,4% |
78 |
92 |
2 |
2,1% |
78 |
80 |
|
Sett the budget of the faculty |
15 |
15,5% |
58 |
73 |
3 |
3,1% |
58 |
61 |
3 |
3,1% |
58 |
61 |
2 |
2,1% |
58 |
60 |
5 |
5,2% |
58 |
63 |
18 |
18,6% |
58 |
76 |
7 |
7,2% |
58 |
65 |
|
Introducing new
academic programs |
41 |
42,3% |
30 |
71 |
5 |
5,2% |
30 |
35 |
6 |
6,2% |
30 |
36 |
4 |
4,1% |
30 |
34 |
8 |
8,2% |
30 |
38 |
17 |
17,5% |
30 |
47 |
11 |
11,3% |
30 |
41 |
|
Introducing new
disciplines |
47 |
48,5% |
22 |
69 |
6 |
6,2% |
22 |
28 |
8 |
8,2% |
22 |
30 |
5 |
5,2% |
22 |
27 |
13 |
13,4% |
22 |
35 |
12 |
12,4% |
22 |
34 |
21 |
21,6% |
22 |
43 |
|
Give up some
disciplines |
42 |
43,3% |
28 |
70 |
3 |
3,1% |
28 |
31 |
7 |
7,2% |
28 |
35 |
4 |
4,1% |
28 |
32 |
9 |
9,3% |
28 |
37 |
13 |
13,4% |
28 |
41 |
16 |
16,5% |
28 |
44 |
|
Evaluation of
students |
32 |
33,0% |
25 |
57 |
8 |
8,2% |
25 |
33 |
5 |
5,2% |
25 |
30 |
20 |
20,6% |
25 |
45 |
8 |
8,2% |
25 |
33 |
12 |
12,4% |
25 |
37 |
22 |
22,7% |
25 |
47 |
|
Evaluation of
academics by students |
21 |
21,6% |
45 |
66 |
0 |
0,0% |
45 |
45 |
2 |
2,1% |
45 |
47 |
10 |
10,3% |
45 |
55 |
1 |
1,0% |
45 |
46 |
11 |
11,3% |
45 |
56 |
19 |
19,6% |
45 |
64 |
Appendix no. 4.7. Members of departments and their roles in the university activities
|
Activity |
Initiative (I) |
Approval (A) |
Planning (P) |
Coordination (C) |
Implementation (Im) |
Monitoring (M) |
Advice (S) |
|||||||||||||||||||||
|
|
No |
% |
Nr |
Tot |
No |
% |
Nr |
Tot |
No |
% |
Nr |
Tot |
No |
% |
Nr |
Tot |
No |
% |
Nr |
Tot |
No |
% |
Nr |
Tot |
No |
% |
Nr |
Tot |
|
Admittance |
|
|
|
|
|
|
|
|
|
|
|
|
|
|
|
|
|
|
|
|
|
|
|
|
|
|
|
|
|
- evaluation criteria |
13 |
13,4% |
45 |
58 |
1 |
1,0% |
45 |
46 |
2 |
2,1% |
45 |
47 |
1 |
1,0% |
45 |
46 |
2 |
2,1% |
45 |
47 |
28 |
28,9% |
45 |
73 |
13 |
13,4% |
45 |
58 |
|
- process |
13 |
13,4% |
44 |
57 |
0 |
0,0% |
44 |
44 |
1 |
1,0% |
44 |
45 |
4 |
4,1% |
44 |
48 |
1 |
1,0% |
44 |
45 |
27 |
27,8% |
44 |
71 |
15 |
15,5% |
44 |
59 |
|
Licencing |
|
|
|
|
|
|
|
|
|
|
|
|
|
|
|
|
|
|
|
|
|
|
|
|
|
|
|
|
|
- criteria |
11 |
11,3% |
46 |
57 |
0 |
0,0% |
46 |
46 |
0 |
0,0% |
46 |
46 |
3 |
3,1% |
46 |
49 |
0 |
0,0% |
46 |
46 |
27 |
27,8% |
46 |
73 |
16 |
16,5% |
46 |
62 |
|
- process |
11 |
11,3% |
44 |
55 |
1 |
1,0% |
44 |
45 |
0 |
0,0% |
44 |
44 |
5 |
5,2% |
44 |
49 |
0 |
0,0% |
44 |
44 |
25 |
25,8% |
44 |
69 |
16 |
16,5% |
44 |
60 |
|
Recruitment |
4 |
4,1% |
65 |
69 |
1 |
1,0% |
65 |
66 |
0 |
0,0% |
65 |
65 |
0 |
0,0% |
65 |
65 |
1 |
1,0% |
65 |
66 |
20 |
20,6% |
65 |
85 |
6 |
6,2% |
65 |
71 |
|
Promotions |
|
|
|
|
|
|
|
|
|
|
|
|
|
|
|
|
|
|
|
|
|
|
|
|
|
|
|
|
|
- criteria |
5 |
5,2% |
60 |
65 |
3 |
3,1% |
60 |
63 |
0 |
0,0% |
60 |
60 |
2 |
2,1% |
60 |
62 |
2 |
2,1% |
60 |
62 |
23 |
23,7% |
60 |
83 |
5 |
5,2% |
60 |
65 |
|
- process |
6 |
6,2% |
57 |
63 |
3 |
3,1% |
57 |
60 |
0 |
0,0% |
57 |
57 |
2 |
2,1% |
57 |
59 |
3 |
3,1% |
57 |
60 |
23 |
23,7% |
57 |
80 |
7 |
7,2% |
57 |
64 |
|
Setting the wages |
4 |
4,1% |
68 |
72 |
4 |
4,1% |
68 |
72 |
0 |
0,0% |
68 |
68 |
0 |
0,0% |
68 |
68 |
0 |
0,0% |
68 |
68 |
19 |
19,6% |
68 |
87 |
3 |
3,1% |
68 |
71 |
|
Dismissal |
3 |
3,1% |
74 |
77 |
4 |
4,1% |
74 |
78 |
0 |
0,0% |
74 |
74 |
1 |
1,0% |
74 |
75 |
0 |
0,0% |
74 |
74 |
15 |
15,5% |
74 |
89 |
3 |
3,1% |
74 |
77 |
|
Sett the curricula |
14 |
14,4% |
39 |
53 |
3 |
3,1% |
39 |
42 |
0 |
0,0% |
39 |
39 |
1 |
1,0% |
39 |
40 |
4 |
4,1% |
39 |
43 |
37 |
38,1% |
39 |
76 |
8 |
8,2% |
39 |
47 |
|
Sett course outline |
35 |
36,1% |
30 |
65 |
1 |
1,0% |
30 |
31 |
0 |
0,0% |
30 |
30 |
2 |
2,1% |
30 |
32 |
8 |
8,2% |
30 |
38 |
28 |
28,9% |
30 |
58 |
18 |
18,6% |
30 |
48 |
|
Sett the enrolment figure |
4 |
4,1% |
66 |
70 |
2 |
2,1% |
66 |
68 |
0 |
0,0% |
66 |
66 |
0 |
0,0% |
66 |
66 |
3 |
3,1% |
66 |
69 |
21 |
21,6% |
66 |
87 |
2 |
2,1% |
66 |
68 |
|
Sett the budget of the university |
3 |
3,1% |
84 |
87 |
1 |
1,0% |
84 |
85 |
0 |
0,0% |
84 |
84 |
0 |
0,0% |
84 |
84 |
1 |
1,0% |
84 |
85 |
9 |
9,3% |
84 |
93 |
1 |
1,0% |
84 |
85 |
|
Sett the budget of the faculty |
3 |
3,1% |
77 |
80 |
2 |
2,1% |
77 |
79 |
0 |
0,0% |
77 |
77 |
1 |
1,0% |
77 |
78 |
2 |
2,1% |
77 |
79 |
14 |
14,4% |
77 |
91 |
2 |
2,1% |
77 |
79 |
|
Introducing new academic programs |
19 |
19,6% |
45 |
64 |
3 |
3,1% |
45 |
48 |
0 |
0,0% |
45 |
45 |
0 |
0,0% |
45 |
45 |
2 |
2,1% |
45 |
47 |
26 |
26,8% |
45 |
71 |
6 |
6,2% |
45 |
51 |
|
Introducing new disciplines |
32 |
33,0% |
36 |
68 |
3 |
3,1% |
36 |
39 |
0 |
0,0% |
36 |
36 |
1 |
1,0% |
36 |
37 |
2 |
2,1% |
36 |
38 |
26 |
26,8% |
36 |
62 |
6 |
6,2% |
36 |
42 |
|
Give up some disciplines |
26 |
26,8% |
46 |
72 |
3 |
3,1% |
46 |
49 |
0 |
0,0% |
46 |
46 |
1 |
1,0% |
46 |
47 |
4 |
4,1% |
46 |
50 |
23 |
23,7% |
46 |
69 |
2 |
2,1% |
46 |
48 |
|
Evaluation of students |
29 |
29,9% |
27 |
56 |
3 |
3,1% |
27 |
30 |
0 |
0,0% |
27 |
27 |
5 |
5,2% |
27 |
32 |
4 |
4,1% |
27 |
31 |
34 |
35,1% |
27 |
61 |
18 |
18,6% |
27 |
45 |
|
Evaluation of academics by students |
7 |
7,2% |
61 |
68 |
0 |
0,0% |
61 |
61 |
0 |
0,0% |
61 |
61 |
2 |
2,1% |
61 |
63 |
0 |
0,0% |
61 |
61 |
26 |
26,8% |
61 |
87 |
7 |
7,2% |
61 |
68 |
Appendix no. 4.8. Factors of postive and of negative motivation for academics at your university (approve = 1, disapprove = 5)
|
|
STATE UNIVERSITIES |
|||||||||||||||||||||||||
|
Positive motivation |
Negative motivation |
|||||||||||||||||||||||||
|
1 |
2 |
3 |
4 |
5 |
Nr |
Total |
1 |
2 |
3 |
4 |
5 |
Nr |
Tot |
|||||||||||||
|
No. |
% |
No. |
% |
No. |
% |
No. |
% |
No. |
% |
|
|
|
No. |
% |
No. |
% |
No. |
% |
No. |
% |
No. |
% |
|
|
|
|
|
Salary/wages |
24 |
33,8% |
16 |
22,5% |
8 |
11,3% |
3 |
4,2% |
5 |
7,0% |
15 |
21,1% |
71 |
6 |
8,5% |
2 |
2,8% |
2 |
2,8% |
2 |
2,8% |
5 |
7,0% |
54 |
76,1% |
71 |
|
Working with
students |
27 |
38,0% |
20 |
28,2% |
14 |
19,7% |
2 |
2,8% |
1 |
1,4% |
7 |
9,9% |
71 |
1 |
1,4% |
0 |
0,0% |
2 |
2,8% |
0 |
0,0% |
2 |
2,8% |
66 |
93,0% |
71 |
|
Scholarships abroad |
22 |
31,0% |
26 |
36,6% |
8 |
11,3% |
4 |
5,6% |
2 |
2,8% |
9 |
12,7% |
71 |
0 |
0,0% |
1 |
1,4% |
1 |
1,4% |
1 |
1,4% |
3 |
4,2% |
65 |
91,5% |
71 |
|
A good material base |
26 |
36,6% |
20 |
28,2% |
8 |
11,3% |
5 |
7,0% |
1 |
1,4% |
11 |
15,5% |
71 |
2 |
2,8% |
1 |
1,4% |
0 |
0,0% |
3 |
4,2% |
2 |
2,8% |
63 |
88,7% |
71 |
|
Others |
3 |
4,2% |
1 |
1,4% |
1 |
1,4% |
1 |
1,4% |
0 |
0,0% |
65 |
91,5% |
71 |
0 |
0,0% |
0 |
0,0% |
0 |
0,0% |
0 |
0,0% |
0 |
0,0% |
71 |
100,0% |
71 |
|
|
PRIVATE UNIVERSITIES |
|||||||||||||||||||||||||
|
|
Positive motivation |
Negative motivation |
||||||||||||||||||||||||
|
|
1 |
2 |
3 |
4 |
5 |
Nr |
Total |
1 |
2 |
3 |
4 |
5 |
Nr |
Tot |
||||||||||||
|
|
No. |
% |
No |
% |
No |
% |
No |
% |
No |
% |
|
|
|
No |
% |
No |
% |
No |
% |
No |
% |
No |
% |
|
|
|
|
Salary/wages |
9 |
34,6% |
13 |
50,0% |
1 |
3,8% |
3 |
11,5% |
0 |
0,0% |
- |
0,0% |
26 |
0 |
0,0% |
1 |
3,8% |
1 |
3,8% |
0 |
0,0% |
2 |
7,7% |
22 |
84,6% |
26 |
|
Working with
students |
16 |
61,5% |
7 |
26,9% |
1 |
3,8% |
0 |
0,0% |
1 |
3,8% |
1 |
3,8% |
26 |
0 |
0,0% |
0 |
0,0% |
0 |
0,0% |
1 |
3,8% |
0 |
0,0% |
25 |
96,2% |
26 |
|
Scholarships abroad |
5 |
19,2% |
8 |
30,8% |
1 |
3,8% |
0 |
0,0% |
1 |
3,8% |
11 |
42,3% |
26 |
0 |
0,0% |
0 |
0,0% |
0 |
0,0% |
1 |
3,8% |
1 |
3,8% |
24 |
92,3% |
26 |
|
A good material base |
16 |
61,5% |
8 |
30,8% |
0 |
0,0% |
2 |
7,7% |
0 |
0,0% |
- |
0,0% |
26 |
0 |
0,0% |
0 |
0,0% |
1 |
3,8% |
0 |
0,0% |
1 |
3,8% |
24 |
92,3% |
26 |
|
Others |
1 |
3,8% |
2 |
7,7% |
0 |
0,0% |
1 |
3,8% |
0 |
0,0% |
22 |
84,6% |
26 |
0 |
0,0% |
0 |
0,0% |
0 |
0,0% |
0 |
0,0% |
2 |
7,7% |
24 |
92,3% |
26 |
Appendix no. 4.9. Corruption of students (as % of persons in total)
|
STUDENTS/ |
Cheating at the admission
exam |
Cheating at exams over the
years |
Send someone else at exam |
Buying essays or projects |
Buying final dissertations |
Buying subjects for licencing |
||||||||||||||||||
|
DEGREE OF CORUPTION |
State |
Private |
State |
Private |
State |
Private |
State |
Private |
State |
Private |
State |
Private |
||||||||||||
|
|
No |
% |
No |
% |
No |
% |
No |
% |
No |
% |
No |
% |
No |
% |
No |
% |
No |
% |
No |
% |
No |
% |
No. |
% |
|
Very large |
0 |
0.0% |
0 |
0.0% |
1 |
1.4% |
0 |
0.0% |
0 |
0.0% |
0 |
0.0% |
1 |
1.4% |
0 |
0.0% |
1 |
1.4% |
1 |
3.8% |
0 |
0.0% |
0 |
0.0% |
|
(over 30%) |
|
|
|
|
|
|
|
|
|
|
|
|
|
|
|
|
|
|
||||||
|
Large |
1 |
1.4% |
0 |
0.0% |
5 |
7.0% |
0 |
0.0% |
0 |
0.0% |
0 |
0.0% |
6 |
8.5% |
2 |
7.7% |
3 |
4.2% |
1 |
3.8% |
0 |
0.0% |
0 |
0.0% |
|
(11-30%) |
|
|
|
|
|
|
|
|
|
|
|
|
|
|
|
|
|
|
||||||
|
Medium |
1 |
1.4% |
1 |
3.8% |
20 |
28.2% |
5 |
19.2% |
0 |
0.0% |
0 |
0.0% |
7 |
9.9% |
1 |
3.8% |
2 |
2.8% |
2 |
7.7% |
1 |
1.4% |
1 |
3.8% |
|
(6-10%) |
|
|
|
|
|
|
|
|
|
|
|
|
|
|
|
|
|
|
||||||
|
Small |
3 |
4.2% |
2 |
7.7% |
15 |
21.1% |
5 |
19.2% |
1 |
1.4% |
0 |
0.0% |
10 |
14.1% |
5 |
19.2% |
14 |
19.7% |
3 |
11.5% |
3 |
4.2% |
1 |
3.8% |
|
(3-5%) |
|
|
|
|
|
|
|
|
|
|
|
|
|
|
|
|
|
|
||||||
|
Very small |
14 |
19.7% |
3 |
11.5% |
24 |
33.8% |
9 |
34.6% |
10 |
14.1% |
2 |
7.7% |
8 |
11.3% |
4 |
15.4% |
9 |
12.7% |
6 |
23.1% |
2 |
2.8% |
0 |
0.0% |
|
(less 2%) |
|
|
|
|
|
|
|
|
|
|
|
|
|
|
|
|
|
|
||||||
|
Does not exist |
50 |
70.4% |
19 |
73.1% |
2 |
2.8% |
5 |
19.2% |
44 |
62.0% |
19 |
73.1% |
22 |
31.0% |
6 |
23.1% |
24 |
33.8% |
7 |
26.9% |
43 |
60.6% |
16 |
61.5% |
|
Don’t know |
1 |
1.4% |
0 |
0.0% |
3 |
4.2% |
2 |
7.7% |
14 |
19.7% |
4 |
15.4% |
16 |
22.5% |
7 |
26.9% |
17 |
23.9% |
5 |
19.2% |
21 |
29.6% |
7 |
26.9% |
|
N.r. |
1 |
1.4% |
1 |
3.8% |
1 |
1.4% |
0 |
0.0% |
2 |
2.8% |
1 |
3.8% |
1 |
1.4% |
1 |
3.8% |
1 |
1.4% |
1 |
3.8% |
1 |
1.4% |
1 |
3.8% |
|
TOTAL |
71 |
|
26 |
|
71 |
|
26 |
|
71 |
|
26 |
|
71 |
|
26 |
|
71 |
|
26 |
|
71 |
|
26 |
|
Appendix no. 4. 10. Corruption of professors (as % of persons in total)
|
STUDENTS/ |
Influence traficking |
Receiving presents from
students |
Receiving money from
students |
Asking for presents to
students |
Asking for money to
students |
Others |
||||||||||||||||||
|
DEGREE OF CORUPTION |
State |
Private |
State |
Private |
State |
Private |
State |
Private |
State |
Private |
State |
Private |
||||||||||||
|
|
No |
% |
No |
% |
No |
% |
No |
% |
No |
% |
No |
% |
No |
% |
No |
% |
No |
% |
No |
% |
No |
% |
No. |
% |
|
Very large |
1 |
1.4% |
0 |
0.0% |
1 |
1.4% |
0 |
0.0% |
1 |
1.4% |
0 |
0.0% |
0 |
0.0% |
0 |
0.0% |
0 |
0.0% |
0 |
0.0% |
0 |
0.0% |
0 |
0.0% |
|
(over 30%) |
|
|
|
|
|
|
|
|
|
|
|
|
|
|
|
|
|
|
||||||
|
Large |
7 |
9.9% |
1 |
3.8% |
2 |
2.8% |
0 |
0.0% |
1 |
1.4% |
0 |
0.0% |
1 |
1.4% |
0 |
0.0% |
1 |
1.4% |
0 |
0.0% |
0 |
0.0% |
0 |
0.0% |
|
(11-30%) |
|
|
|
|
|
|
|
|
|
|
|
|
|
|
|
|
|
|
||||||
|
Medium |
9 |
12.7% |
4 |
15.4% |
4 |
5.6% |
5 |
19.2% |
2 |
2.8% |
1 |
3.8% |
2 |
2.8% |
2 |
7.7% |
1 |
1.4% |
0 |
0.0% |
2 |
2.8% |
0 |
0.0% |
|
(6-10%) |
|
|
|
|
|
|
|
|
|
|
|
|
|
|
|
|
|
|
||||||
|
Small |
13 |
18.3% |
4 |
15.4% |
9 |
12.7% |
2 |
7.7% |
3 |
4.2% |
2 |
7.7% |
2 |
2.8% |
1 |
3.8% |
2 |
2.8% |
2 |
7.7% |
0 |
0.0% |
0 |
0.0% |
|
(3-5%) |
|
|
|
|
|
|
|
|
|
|
|
|
|
|
|
|
|
|
||||||
|
Very small |
22 |
31.0% |
7 |
26.9% |
12 |
16.9% |
4 |
15.4% |
3 |
4.2% |
0 |
0.0% |
6 |
8.5% |
2 |
7.7% |
4 |
5.6% |
2 |
7.7% |
0 |
0.0% |
1 |
3.8% |
|
(less 2%) |
|
|
|
|
|
|
|
|
|
|
|
|
|
|
|
|
|
|
||||||
|
Does not exist |
7 |
9.9% |
5 |
19.2% |
20 |
28.2% |
12 |
46.2% |
34 |
47.9% |
15 |
57.7% |
35 |
49.3% |
15 |
57.7% |
36 |
50.7% |
15 |
57.7% |
66 |
93.0% |
25 |
96.2% |
|
Don’t know |
11 |
15.5% |
4 |
15.4% |
22 |
31.0% |
2 |
7.7% |
26 |
36.6% |
7 |
26.9% |
24 |
33.8% |
5 |
19.2% |
26 |
36.6% |
6 |
23.1% |
2 |
2.8% |
0 |
0.0% |
|
N.r. |
1 |
1.4% |
1 |
3.8% |
1 |
1.4% |
1 |
3.8% |
1 |
1.4% |
1 |
3.8% |
1 |
1.4% |
1 |
3.8% |
1 |
1.4% |
1 |
3.8% |
1 |
1.4% |
0 |
0.0% |
|
TOTAL |
71 |
|
26 |
|
71 |
|
26 |
|
71 |
|
26 |
|
71 |
|
26 |
|
71 |
|
26 |
|
71 |
|
26 |
|
Appendix no. 4. 11. Corruption at secretarial level (as % of persons in total)
|
STUDENTS/ |
Influencing professors |
Receiving presents of money
from students |
Asking presents of money
from students |
Transcribying wrongly the
marks in the centralizor |
Selling the final
dissertations from the arhive |
Others |
||||||||||||||||||
|
DEGREE OF CORUPTION |
State |
Private |
State |
Private |
State |
Private |
State |
Private |
State |
Private |
State |
Private |
||||||||||||
|
|
No |
% |
No |
% |
No |
% |
No |
% |
No |
% |
No |
% |
No |
% |
No |
% |
No |
% |
No |
% |
No |
% |
No. |
% |
|
Very large |
0 |
0.0% |
0 |
0.0% |
0 |
0.0% |
0 |
0.0% |
0 |
0.0% |
0 |
0.0% |
0 |
0.0% |
0 |
0.0% |
0 |
0.0% |
0 |
0.0% |
0 |
0.0% |
0 |
0.0% |
|
(over 30%) |
|
|
|
|
|
|
|
|
|
|
|
|
|
|
|
|
|
|
||||||
|
Large |
0 |
0.0% |
0 |
0.0% |
0 |
0.0% |
0 |
0.0% |
1 |
1.4% |
0 |
0.0% |
0 |
0.0% |
0 |
0.0% |
0 |
0.0% |
1 |
3.8% |
0 |
0.0% |
0 |
0.0% |
|
(11-30%) |
|
|
|
|
|
|
|
|
|
|
|
|
|
|
|
|
|
|
||||||
|
Medium |
3 |
4.2% |
2 |
7.7% |
2 |
2.8% |
2 |
7.7% |
3 |
4.2% |
1 |
3.8% |
0 |
0.0% |
0 |
0.0% |
0 |
0.0% |
0 |
0.0% |
0 |
0.0% |
0 |
0.0% |
|
(6-10%) |
|
|
|
|
|
|
|
|
|
|
|
|
|
|
|
|
|
|
||||||
|
Small |
3 |
4.2% |
2 |
7.7% |
3 |
4.2% |
0 |
0.0% |
3 |
4.2% |
2 |
7.7% |
3 |
4.2% |
1 |
3.8% |
1 |
1.4% |
0 |
0.0% |
0 |
0.0% |
0 |
0.0% |
|
(3-5%) |
|
|
|
|
|
|
|
|
|
|
|
|
|
|
|
|
|
|
||||||
|
Very small |
19 |
26.8% |
6 |
23.1% |
5 |
7.0% |
2 |
7.7% |
9 |
12.7% |
3 |
11.5% |
13 |
18.3% |
4 |
15.4% |
1 |
1.4% |
2 |
7.7% |
0 |
0.0% |
0 |
0.0% |
|
(less 2%) |
|
|
|
|
|
|
|
|
|
|
|
|
|
|
|
|
|
|
||||||
|
Does not exist |
33 |
46.5% |
11 |
42.3% |
41 |
57.7% |
17 |
65.4% |
35 |
49.3% |
13 |
50.0% |
43 |
60.6% |
17 |
65.4% |
52 |
73.2% |
18 |
69.2% |
69 |
97.2% |
25 |
96.2% |
|
Don’t know |
12 |
16.9% |
4 |
15.4% |
19 |
26.8% |
4 |
15.4% |
19 |
26.8% |
6 |
23.1% |
11 |
15.5% |
3 |
11.5% |
16 |
22.5% |
4 |
15.4% |
1 |
1.4% |
0 |
0.0% |
|
N.r. |
1 |
1.4% |
1 |
3.8% |
1 |
1.4% |
1 |
3.8% |
1 |
1.4% |
1 |
3.8% |
1 |
1.4% |
1 |
3.8% |
1 |
1.4% |
1 |
3.8% |
1 |
1.4% |
1 |
3.8% |
|
TOTAL |
71 |
|
26 |
|
71 |
|
26 |
|
71 |
|
26 |
|
71 |
|
26 |
|
71 |
|
26 |
|
71 |
|
26 |
|
Appendix no. 4.12. Degree of agreement/disagreement of respondents with statements comparing state/private HE.
|
No. |
Statement |
State |
Private |
||||||||||||||||||
|
1 |
2 |
3 |
4 |
5 |
1 |
2 |
3 |
4 |
5 |
||||||||||||
|
No. |
% |
No. |
% |
No. |
% |
No. |
% |
No. |
% |
No. |
% |
No. |
% |
No. |
% |
No. |
% |
No. |
% |
||
|
1. |
The capacity of a person to be performing at
the work place depends to a large extent of the faculty that he/she graduated |
16 |
22.5% |
33 |
46.5% |
13 |
18.3% |
3 |
4.2% |
5 |
7.0% |
3 |
11.5% |
18 |
69.2% |
1 |
3.8% |
2 |
7.7% |
2 |
7.7% |
|
2. |
The capacity of a person to be performing at
the work place depends to a large extent of the personal abilities regardless
the studies he/she has |
14 |
19.7% |
22 |
31.0% |
11 |
15.5% |
15 |
21.1% |
7 |
9.9% |
7 |
26.9% |
13 |
50.0% |
4 |
15.4% |
2 |
7.7% |
0 |
0.0% |
|
3. |
Generally speaking, the state HE has the
same quality as the private HE |
5 |
7.0% |
5 |
7.0% |
8 |
11.3% |
23 |
32.4% |
28 |
39.4% |
5 |
19.2% |
13 |
50.0% |
4 |
15.4% |
2 |
7.7% |
2 |
7.7% |
|
4. |
Professors at the state universities are
better trained than the professors at private universities |
21 |
29.6% |
22 |
31.0% |
15 |
21.1% |
6 |
8.5% |
6 |
8.5% |
1 |
3.8% |
2 |
7.7% |
6 |
23.1% |
2 |
7.7% |
14 |
53.8% |
|
5. |
The material base (classes, books,
libraries) of state universities are better than that of private universities |
25 |
35.2% |
26 |
36.6% |
7 |
9.9% |
10 |
14.1% |
1 |
1.4% |
2 |
7.7% |
8 |
30.8% |
3 |
11.5% |
6 |
23.1% |
6 |
23.1% |
|
6. |
High school graduates who go to state
universities are better trained than those who go to private universities |
48 |
67.6% |
14 |
19.7% |
5 |
7.0% |
0 |
0.0% |
3 |
4.2% |
2 |
7.7% |
10 |
38.5% |
3 |
11.5% |
3 |
11.5% |
8 |
30.8% |
|
7. |
Admission exams at private universities are
easier than at the state universities |
52 |
73.2% |
11 |
15.5% |
2 |
2.8% |
2 |
2.8% |
2 |
2.8% |
0 |
0.0% |
11 |
42.3% |
3 |
11.5% |
4 |
15.4% |
7 |
26.9% |
|
8. |
Activities in state universities are more serious
than in private universities |
36 |
50.7% |
18 |
25.4% |
10 |
14.1% |
2 |
2.8% |
2 |
2.8% |
0 |
0.0% |
1 |
3.8% |
2 |
7.7% |
4 |
15.4% |
19 |
73.1% |
|
9. |
Students work more in state universities
than in private universities |
30 |
42.3% |
20 |
28.2% |
15 |
21.1% |
2 |
2.8% |
2 |
2.8% |
0 |
0.0% |
1 |
3.8% |
4 |
15.4% |
3 |
11.5% |
18 |
69.2% |
|
10. |
Graduates of private universities are
trained professionally at a similar level with the state universities
graduates |
1 |
1.4% |
10 |
14.1% |
16 |
22.5% |
24 |
33.8% |
17 |
23.9% |
16 |
61.5% |
6 |
23.1% |
3 |
11.5% |
0 |
0.0% |
1 |
3.8% |
|
11. |
Diplomas from state universities are seen in
the labour market in a similar way with those from private universities |
4 |
5.6% |
14 |
19.7% |
22 |
31.0% |
15 |
21.1% |
13 |
18.3% |
7 |
26.9% |
11 |
42.3% |
3 |
11.5% |
5 |
19.2% |
0 |
0.0% |
|
12. |
Graduates from state universities are more
looked for in the labour market than private university graduates |
21 |
29.6% |
26 |
36.6% |
16 |
22.5% |
3 |
4.2% |
2 |
2.8% |
1 |
3.8% |
9 |
34.6% |
4 |
15.4% |
8 |
30.8% |
4 |
15.4% |
|
13. |
Graduates from state universities have a
pro-active attitude and assume more risks than those from private
universities |
13 |
18.3% |
16 |
22.5% |
31 |
43.7% |
4 |
5.6% |
3 |
4.2% |
0 |
0.0% |
3 |
11.5% |
1 |
3.8% |
3 |
11.5% |
19 |
73.1% |
|
14. |
The firms’ participation in the Management
Boards of universities can contribute to the improvement of HE. |
27 |
38.0% |
17 |
23.9% |
10 |
14.1% |
7 |
9.9% |
8 |
11.3% |
9 |
34.6% |
8 |
30.8% |
4 |
15.4% |
2 |
7.7% |
2 |
7.7% |
|
|
N.r. |
2 |
2.8% |
2 |
2.8% |
2 |
2.8% |
2 |
2.8% |
2 |
2.8% |
2 |
7.7% |
2 |
7.7% |
2 |
7.7% |
2 |
7.7% |
2 |
7.7% |
|
|
TOTAL |
71 |
|
71 |
|
71 |
|
71 |
|
71 |
|
26 |
|
26 |
|
26 |
|
26 |
|
26 |
|
|
|
|
|
|
|
|
|
|
|
|
|
|
|
|
|
|
|
|
|
|
|
|
Appendix no. 4.13. Number of students at faculty level for different type of programs
|
Faculty Level |
Day classes |
Distance Learning |
Advanced studies |
Master |
Doctorate |
|||||||||||||||
|
Number of students |
State |
Private |
State |
Private |
State |
Private |
State |
Private |
State |
Private |
||||||||||
|
67 faculties |
No |
% |
No |
% |
No |
% |
No |
% |
No |
% |
No |
% |
No |
% |
No |
% |
No |
% |
No |
% |
|
Fee paying students |
|
|
|
|
|
|
|
|
|
|
|
|
|
|
|
|
|
|
|
|
|
under 100 students |
12 |
17,9% |
0 |
0,0% |
4 |
6,0% |
1 |
4,5% |
16 |
23,9% |
1 |
4,5% |
37 |
55,2% |
3 |
13,6% |
15 |
22,4% |
1 |
4,5% |
|
between 100 and 250 |
13 |
19,4% |
6 |
27,3% |
5 |
7,5% |
1 |
4,5% |
2 |
3,0% |
0 |
0,0% |
2 |
3,0% |
0 |
0,0% |
1 |
1,5% |
0 |
0,0% |
|
between 250 and 500 |
11 |
16,4% |
6 |
27,3% |
9 |
13,4% |
3 |
13,6% |
0 |
0,0% |
0 |
0,0% |
1 |
1,5% |
0 |
0,0% |
0 |
0,0% |
0 |
0,0% |
|
between 500 and 750 |
11 |
16,4% |
4 |
18,2% |
2 |
3,0% |
0 |
0,0% |
0 |
0,0% |
0 |
0,0% |
0 |
0,0% |
0 |
0,0% |
0 |
0,0% |
0 |
0,0% |
|
over 750 students |
11 |
16,4% |
1 |
4,5% |
7 |
10,4% |
0 |
0,0% |
0 |
0,0% |
0 |
0,0% |
0 |
0,0% |
0 |
0,0% |
0 |
0,0% |
0 |
0,0% |
|
N.r |
9 |
13,4% |
5 |
22,7% |
40 |
59,7% |
17 |
77,3% |
49 |
73,1% |
21 |
95,5% |
27 |
40,3% |
19 |
86,4% |
51 |
76,1% |
21 |
95,5% |
|
TOTAL answers question |
58 |
86,6% |
7 |
77,3% |
27 |
40,3% |
5 |
22,7% |
18 |
26,9% |
1 |
4,5% |
40 |
59,7% |
3 |
13,6% |
16 |
23,9% |
1 |
4,5% |
|
TOTAL respondents |
67 |
|
22 |
|
67 |
|
22 |
|
67 |
|
22 |
|
67 |
|
22 |
|
67 |
|
22 |
|
|
Average no of students |
513 |
800 |
609 |
599 |
35 |
50 |
47 |
31 |
24 |
2 |
||||||||||
|
Budgetary students |
|
|
|
|
|
|
|
|
|
|
|
|
|
|
|
|
|
|
|
|
|
under 100 students |
1 |
1,5% |
1 |
4,5% |
6 |
9,0% |
2 |
9,1% |
23 |
34,3% |
0 |
0,0% |
35 |
52,2% |
1 |
4,5% |
27 |
40,3% |
0 |
0,0% |
|
between 100 and 250 |
3 |
4,5% |
2 |
9,1% |
1 |
1,5% |
0 |
0,0% |
2 |
3,0% |
0 |
0,0% |
6 |
9,0% |
0 |
0,0% |
6 |
9,0% |
0 |
0,0% |
|
between 250 and 500 |
16 |
23,9% |
0 |
0,0% |
1 |
1,5% |
0 |
0,0% |
0 |
0,0% |
0 |
0,0% |
0 |
0,0% |
0 |
0,0% |
6 |
9,0% |
0 |
0,0% |
|
between 500 and 750 |
18 |
26,9% |
0 |
0,0% |
1 |
1,5% |
0 |
0,0% |
0 |
0,0% |
0 |
0,0% |
0 |
0,0% |
0 |
0,0% |
1 |
1,5% |
0 |
0,0% |
|
over 750 students |
20 |
29,9% |
0 |
0,0% |
1 |
1,5% |
0 |
0,0% |
0 |
0,0% |
0 |
0,0% |
0 |
0,0% |
0 |
0,0% |
0 |
0,0% |
0 |
0,0% |
|
N.r |
9 |
13,4% |
19 |
86,4% |
57 |
85,1% |
20 |
90,9% |
42 |
62,7% |
22 |
100,0% |
26 |
38,8% |
21 |
95,5% |
27 |
40,3% |
22 |
100,0% |
|
TOTAL answers question |
58 |
86,6% |
3 |
13,6% |
10 |
14,9% |
2 |
9,1% |
25 |
37,3% |
0 |
0,0% |
41 |
61,2% |
1 |
4,5% |
40 |
59,7% |
0 |
0,0% |
|
TOTAL respondents |
67 |
|
22 |
|
67 |
|
22 |
|
67 |
|
22 |
|
67 |
|
22 |
|
67 |
|
22 |
|
|
Average no of students |
827 |
85 |
259 |
58 |
32 |
0 |
51 |
2 |
108 |
0 |
||||||||||